AI for Flash Flood Susceptibility: Mapping Risk with Graph Neural Networks and Uncertainty Quantification
Discover how Graph Neural Networks enhance flash flood susceptibility mapping by modeling river connectivity, offering unprecedented accuracy and confidence ranges for global disaster preparedness.

The Critical Flaw in Traditional Flood Mapping: Grids vs. Valleys
Flash floods represent one of the most devastating natural hazards globally, causing extensive fatalities and economic disruption annually. In regions like Himachal Pradesh (HP), India, these events are particularly catastrophic, with the 2023 monsoon season alone leading to over 400 confirmed fatalities and an estimated $1.2 billion in economic losses. These figures underscore an urgent need for more precise and reliable flood risk assessment. Historically, flood susceptibility maps have often relied on a "pixel-based" approach, treating each geographical location as an independent entity. This method fundamentally overlooks a critical hydrological reality: water doesn't flow through an isolated grid; it moves downhill through interconnected river valleys and watersheds. This inherent limitation in traditional mapping can lead to significant inaccuracies and underestimated risks, especially in complex terrains where upstream conditions directly influence downstream flood potential.
This challenge has propelled researchers to explore advanced artificial intelligence (AI) methodologies that can better represent the physical world. The fundamental question is whether AI can learn to "think" like water flows, incorporating the interconnectedness of a landscape into its predictive models. The answer, as recent research demonstrates, lies in leveraging Graph Neural Networks (GNNs) – a class of AI designed to understand relationships and connections within data. By explicitly modeling how water propagates through a network of river basins, GNNs can provide a more accurate and actionable understanding of flood risk.
Graph Neural Networks: AI That Follows the Water’s Path
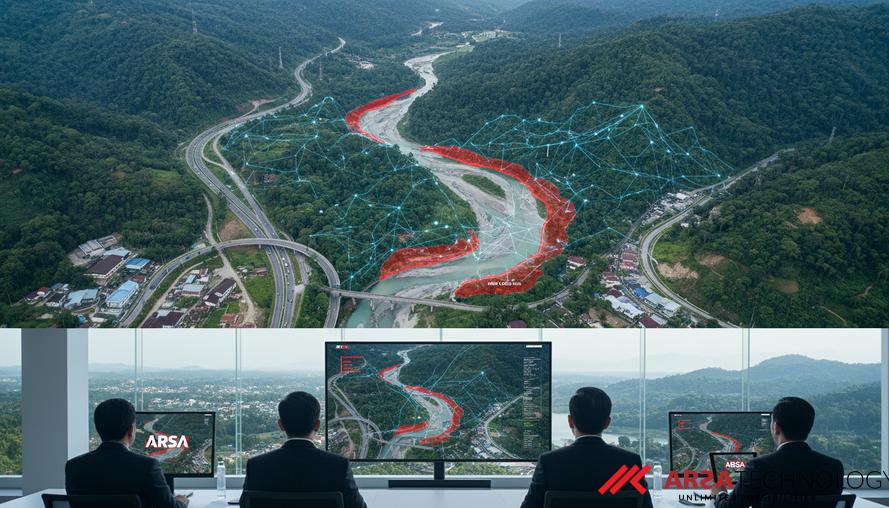
To overcome the limitations of grid-based models, a pioneering study employed a sophisticated approach centered on Graph Neural Networks (GNNs), specifically a variant called GraphSAGE. Instead of analyzing individual pixels, this method transformed the geography of Himachal Pradesh into a dynamic "watershed connectivity graph." In this graph, each node represents a sub-watershed, and directed edges illustrate the flow of water from one upstream sub-watershed to its downstream counterpart. This innovative graph structure explicitly encodes the critical hydrological principle that increased water flow or flooding upstream directly amplifies flood risk in connected downstream areas.
The GraphSAGE model was trained on a comprehensive flood inventory compiled over six years (2018–2023). This inventory leveraged Sentinel-1 radar imagery processed in Google Earth Engine, a crucial technique for monsoon seasons where traditional optical satellite imagery is often obscured by cloud cover. By detecting changes in radar signals, researchers could accurately pinpoint over 3,000 georeferenced flood locations across HP. This data, combined with twelve environmental variables covering terrain, hydrology, land cover, soil, and rainfall at a high 30-meter resolution, provided the AI with a rich dataset to learn from. The power of GNNs lies in their ability to process these complex spatial relationships, moving beyond isolated data points to capture the full, interconnected picture of a river system.
Building a Comprehensive Flood Intelligence System
Beyond the novel application of Graph Neural Networks, this research introduced several critical advancements to ensure the robustness and practical utility of flood susceptibility mapping. A common pitfall in many machine learning studies is the use of random train-test splits, which can artificially inflate model accuracy by 5-15% because adjacent data points often share similar characteristics. To counteract this, the study implemented a rigorous "leave-one-basin-out cross-validation" strategy. This involved dividing Himachal Pradesh into its five major river basins and iteratively training the models on four basins while testing on the fifth, ensuring that the model's performance was evaluated on entirely unseen geographic areas. This method provides a more realistic assessment of how the model would perform in a new, unmapped region, crucial for real-world deployment.
Furthermore, a significant innovation was the integration of conformal prediction, a statistical technique that produces "statistically guaranteed 90% coverage intervals." Unlike traditional models that output a single probability score, conformal prediction generates a range, or interval, within which the true flood risk is expected to lie with a specified level of confidence. This means decision-makers can now differentiate between areas where the model is highly certain about its prediction and those where uncertainty is greater, enabling more nuanced and confident risk management. For instance, AI Video Analytics systems often benefit from such uncertainty quantification in critical applications, providing operators with a clearer understanding of potential risks. These combined methodologies establish a new standard for precision and reliability in flood susceptibility mapping (Sharma & Sharma, 2026).
Key Findings: A New Benchmark for Flood Risk Accuracy
The results of this study unequivocally demonstrate the superiority of the watershed-aware Graph Neural Network. The GNN achieved an impressive Area Under the Curve (AUC) of 0.978 ± 0.017. This significantly outperformed the best pixel-based models, including a sophisticated stacking ensemble, which reached an AUC of 0.881, and a previously published benchmark for the region with an AUC of 0.88. The nearly 0.10 point increase in AUC confirms that the explicit encoding of river connectivity provides a "real predictive signal" that traditional grid-based models simply cannot capture. This substantial gain in accuracy highlights the immense value of understanding and integrating natural flow dynamics into AI-driven flood prediction.
The conformal prediction intervals, while proving the model's overall statistical guarantee, also revealed insightful nuances. An empirical coverage of 82.9% was achieved on the held-out 2023 test set. Interestingly, lower coverage in high-risk zones (45–59%) suggested potential "label noise" in the SAR-derived training data, pinpointing an area for future research to further refine data quality. Such transparency in uncertainty quantification is invaluable for organizations, allowing them to understand not just what the model predicts, but also how confident it is in that prediction. This allows for a more strategic allocation of resources and planning for potential interventions.
Actionable Insights for Disaster Preparedness
The practical implications of these highly accurate and confidence-rated flood susceptibility maps are profound, particularly for regional disaster management authorities and infrastructure planning. The identified high-susceptibility zones in Himachal Pradesh directly overlap with 1,457 km of vital national and state highways, including a significant 217 km stretch of the critical Manali–Leh highway. Furthermore, these zones imperil 2,759 bridges and 4 major hydroelectric installations. This granular, location-specific data allows the HP State Disaster Management Authority to prioritize interventions, such as strengthening infrastructure, implementing early warning systems, and optimizing emergency response routes.
The ability to predict flood risk with greater accuracy and understand the associated uncertainty offers a powerful tool for proactive disaster mitigation. For global enterprises managing large-scale infrastructure, logistics, or even urban development, such insights can translate into massive reductions in potential losses and enhanced operational safety. For example, similar AI and IoT solutions, such as ARSA’s AI BOX - Traffic Monitor, can analyze traffic flow and detect incidents, offering another layer of intelligence in smart city and critical infrastructure management. By shifting from reactive responses to predictive preparedness, these advanced AI models empower decision-makers to build more resilient communities and protect invaluable assets. ARSA Technology, for instance, has been experienced since 2018 in deploying such AI and IoT solutions for mission-critical operations across various industries.
The Future of Predictive Flood Mapping
This study represents a significant leap forward in flash flood susceptibility mapping, demonstrating that intelligent AI models, specifically Graph Neural Networks, can significantly outperform traditional methods by mirroring the natural flow of water. The explicit modeling of watershed connectivity provides a blueprint for more accurate risk assessments in mountainous and riverine regions worldwide. The integration of conformal prediction further empowers decision-makers by providing statistically guaranteed confidence intervals, allowing for more informed and strategic planning in the face of natural hazards.
The findings from this research, originally published as Flood Risk Follows Valleys, Not Grids: Graph Neural Networks for Flash Flood Susceptibility Mapping in Himachal Pradesh with Conformal Uncertainty Quantification, underscore the transformative potential of advanced AI and robust data analytics in addressing pressing global challenges. As natural disasters continue to intensify, the demand for sophisticated, reliable, and actionable predictive intelligence will only grow. Organizations that embrace these cutting-edge technologies will be better equipped to protect lives, safeguard infrastructure, and ensure economic stability in an increasingly unpredictable world.
Explore how advanced AI and IoT solutions can transform your operational intelligence and risk management strategies. Request a free consultation with the ARSA team today to discuss your specific needs.