
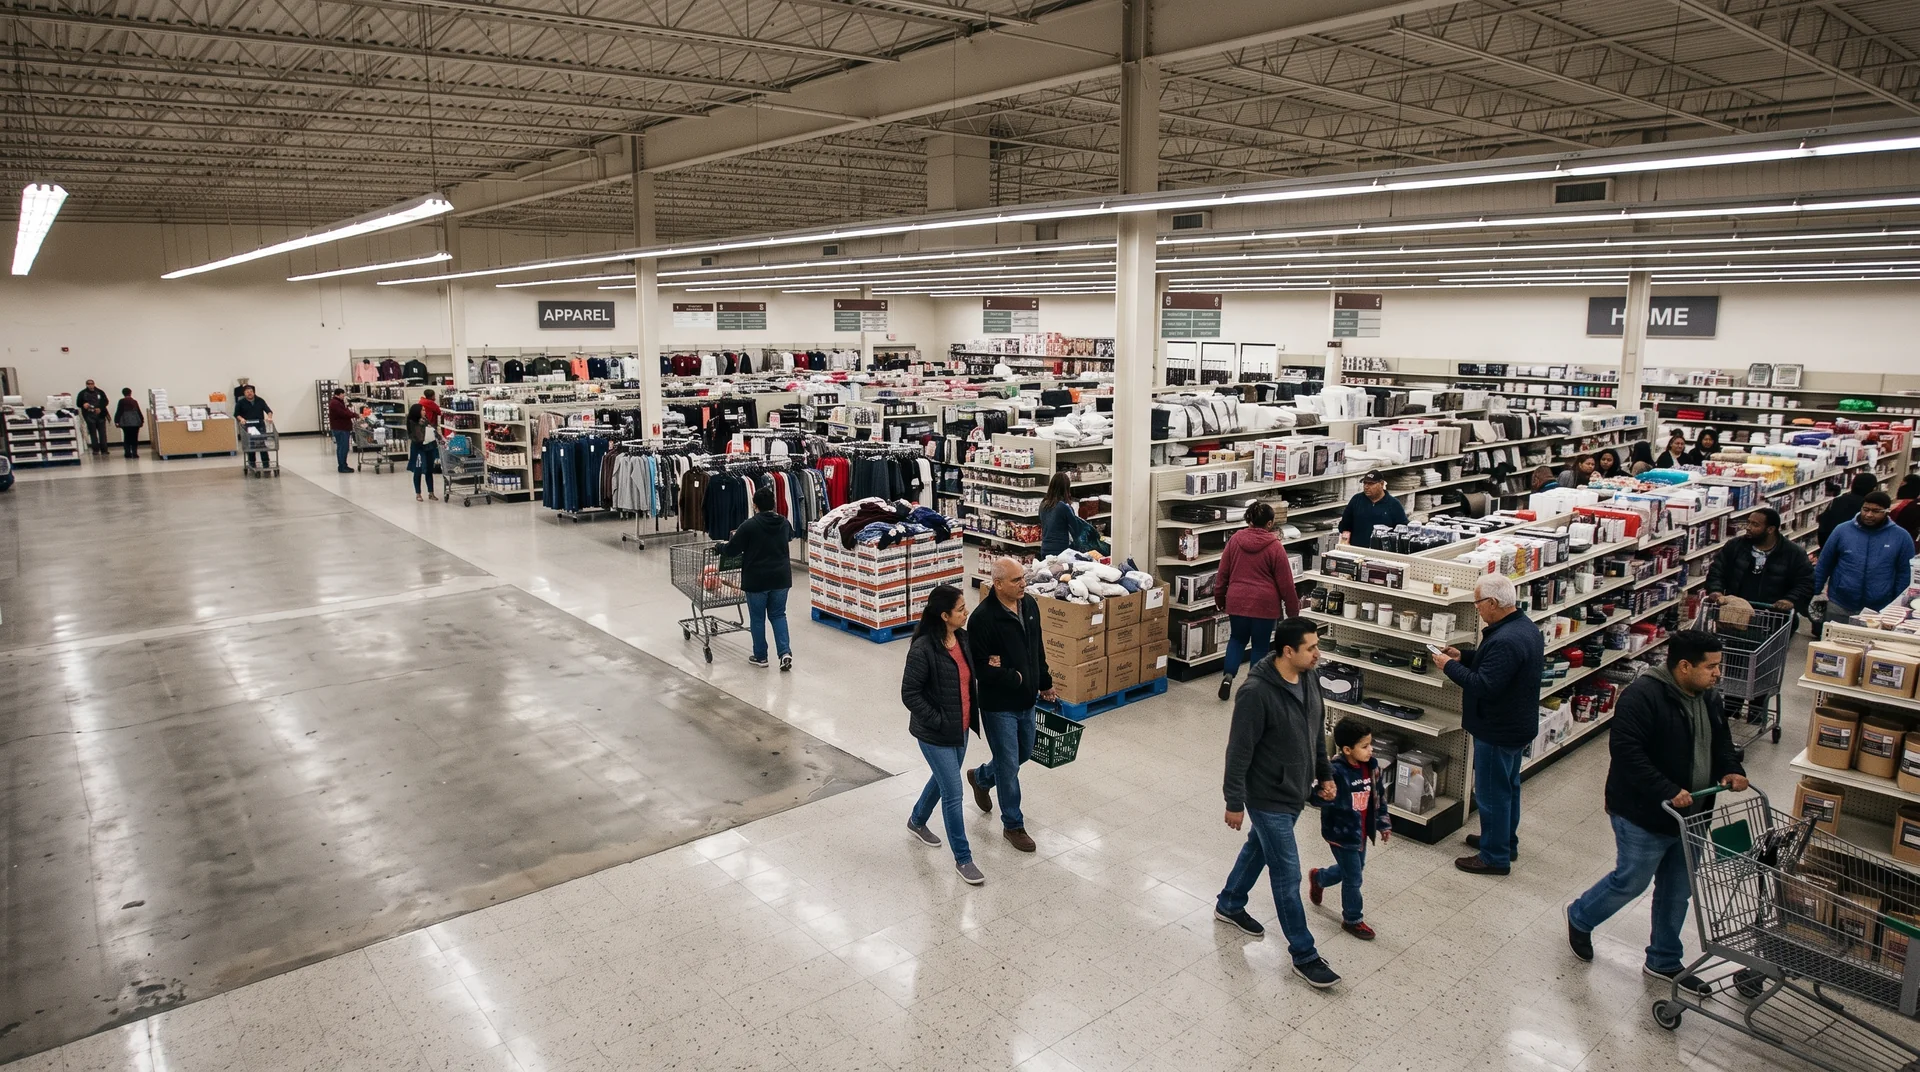

A chain with 60 stores collects 60 entry counts every evening, and the head office team still has to decide which three stores get a refit this year. Raw footfall is a poor guide to that decision, because a 900 square metre high street flagship and a 250 square metre retail park unit will never post the same number. Benchmarking foot traffic across store locations works when every store is counted the same way and every count is divided by something that makes the stores comparable.
THE QUESTION
What Cross-Site Footfall Benchmarking Is For
Cross-site benchmarking ranks stores against their peers on normalised traffic measures, so that capital, labour and refit budgets go to the sites with the largest gap. It answers a question about the whole estate: which store underperforms given the visitors it already receives.
That is a separate job from the single-store work covered in our guide to measuring retail store conversion rate. Conversion helps one store manager coach a floor team. Benchmarking can tell an operations director that store 14 gets as many visitors per trading hour as store 3 but converts at two thirds of the rate. It can also show that store 22 has till queues twice as long as any other store of its format. The first finding is a coaching problem. The second and third are decisions about money.
UK and Australian chains usually run the comparison across formats (high street, shopping centre, retail park, travel) and across regions with different trading hours. Those differences are why raw counts mislead, and why the number you divide by matters as much as the count.
THE METRICS
Which Measures Make Stores Comparable
Divide each store’s count by its trading hours, its selling area or its transactions, and compare stores only within the same format. A ranking built on raw weekly entries mostly ranks store size and location.
| Measure | How It Is Calculated | What It Tells Head Office | Where The Inputs Come From |
|---|---|---|---|
| Visitors per trading hour | Entries divided by opening hours | How busy the store is, whatever its opening hours | Entry counts plus the store schedule |
| Visitors per square metre | Entries divided by selling area | Whether the space earns its rent | Entry counts plus property records |
| Conversion rate | Transactions divided by entries | How well traffic turns into sales | Entry counts plus your point of sale data |
| Peak queue wait | Average wait at the till in the busiest hour | Where staffing falls short of demand | Camera queue zone |
| Dwell time by zone | Average time spent in a defined floor zone | Which departments hold attention | Camera floor zone |
| Hourly traffic profile | Entries by hour set against the roster | Whether rosters follow demand | Entry counts plus your roster |
A camera system supplies the entries, queue waits and dwell times. Transactions, floor areas and rosters live in your own systems, and your analysts join them in the reporting tool they already use. Two habits keep the ranking honest. First, compare each week with the same week in other years so that school holidays and Christmas trading do not distort the picture. Second, index each store against its own trailing baseline as well as against its peers, so that a store recovering from a road closure is not marked down twice.
THE MEASUREMENT PROBLEM
Why Benchmarks Fail Before The Analysis Starts
Most cross-site benchmarks fail because stores are counted with different equipment, camera positions or counting rules. Part of every gap between two stores is then a gap between two sensors. Three sources account for most of it.
Mixed Counting Hardware
Estates built up over a decade often carry door counters from several vendors, each with its own error rate. The difference between two sensors can be larger than the real gap between the two stores you are trying to rank. Where old counters stay in place, run them alongside the new counts for a period and record the difference for each store.
Camera Geometry That Varies
Entry and exit line counting needs a near-overhead view, 60 to 90 degrees below horizontal. Below 30 degrees, people walking together hide one another and the system undercounts. A store whose only entrance camera sits at 25 degrees will look quieter than it is, and could lose a refit because of how its camera was mounted.
Counting Rules That Drift
One store counts the goods-in door and another does not. One draws its line across the inner door of a vestibule, another across the outer door. Write one rule for the whole estate, for example customer entrances only with the line on the inner threshold. Before the figures feed a decision, ask ARSA how staff walking through will be handled at your sites.
THE STANDARD
Setting One Counting Standard Across The Estate
Write the counting standard down before the rollout and hold every store to it, using measurable camera figures. ARSA publishes those figures in its camera and site standard, ARSA-CVS-001.
| Requirement | Entry And Exit Line Counting | Queue Length And Wait Time |
|---|---|---|
| Pixel density at the measurement point | 113 PPM | 99 PPM |
| Camera angle below horizontal | 60 to 90 degrees | 30 to 50 degrees, 55 maximum |
| Minimum light at target | 50 lux | 50 lux |
| Maximum distance, 2 MP camera, standard 60 degree lens | 14.7 m | 16.8 m |
| Maximum distance, 4 MP camera, standard 60 degree lens | 19.6 m | 22.4 m |
| Camera minimum | 2 MP, 15 fps | 2 MP, 15 fps |
| Camera recommended | 4 MP | 4 MP |
Three camera settings matter more when you compare stores than when you measure one. Time synchronisation over NTP, with under one second of drift, keeps hourly profiles lined up across 60 sites. Constant bit rate keeps the picture quality up at the busiest moments, which are the moments the comparison cares about most. Smart codecs such as H.264+ should be switched off on the stream the analytics read.
Then check the counts. Hand count one busy hour per store, compare it with the system’s figure, and keep the result on file. If a store’s counts drift later, that record shows it. If you want your existing cameras checked before you commit money, ARSA’s Remote Camera Design Review costs $1,500 and takes one week. An On-Site Camera Survey costs $4,500 plus travel and covers up to 50 cameras. Either fee is deducted from the project fee if you sign within 90 days. Details are on the services page.
THE ROLLOUT
Two Ways To Collect Counts From Every Store
A chain can place one small appliance in each store’s back office, or it can run the software centrally on head office servers. The choice depends on whether store cameras already stream back to head office.
One appliance per store. The AI Box Mini handles up to three camera streams and costs $1,890. The Retail Counter module on subscription is $29 per camera per month. For 40 stores with three cameras each, that is $75,600 in hardware and $3,480 a month in licences. Units ship already configured and take about 15 minutes to connect at each site. They then report into one dashboard for the whole chain.
Central software. Where stores already send camera video to head office, the same 120 cameras cost $3,480 a month at $29 per camera, billed annually. The alternative is $870 per camera as a perpetual licence, with optional maintenance at 18% of the licence a year. There is a four-camera minimum. You buy no hardware for the stores, but you supply the server capacity, and your network has to carry the video. A 2 MP stream runs at about 2.48 Mbps, so three cameras send roughly 7.4 Mbps upstream from every store, all day.
Either route gives counts per store, per region and for the whole chain. They can be exported as CSV or PDF, or pushed by REST API, webhook or MQTT into your BI tools. The data sits on your servers, and ARSA does not hold it.
For chains outside Indonesia, list prices are in USD and invoicing is available in USD or EUR. Where visa conditions prevent ARSA engineers from travelling, a qualified local partner installs under ARSA supervision.
THE PRIVACY POSITION
What The Data Contains And What It Leaves Out
The Smart Retail Counter counts anonymous shapes and creates no face templates. It cannot recognise a returning shopper in one store or follow a shopper from one store to another. That matters for benchmarking: a customer who visits two of your stores in a week is counted once in each, and this system cannot tell you how often people come back. The module does estimate age and gender, reported as totals for each store.
UK chains should still assess the deployment. The ICO and the Surveillance Camera Commissioner have published joint DPIA guidance for surveillance camera systems, and a DPIA (data protection impact assessment) is expected where new technology tracks behaviour. In Australia, Australian Privacy Principle 3 limits collection to what is reasonably necessary. The OAIC also treats biometric data from facial recognition in retail as sensitive information, which needs consent. A system that counts without recognising anyone keeps the assessment simple. A sign at the door saying so keeps shoppers informed.
Frequently Asked Questions
How Do You Compare Foot Traffic Between Stores Of Different Sizes?
Divide entries by selling area or trading hours, then compare stores only within the same format. A flagship and a convenience unit measured on raw entries will always rank by size, which tells head office nothing it did not already know.
How Accurate Does People Counting Need To Be For Store Benchmarking?
Above all, it needs to be consistent across stores, because a benchmark compares stores with each other. A 3% error that is the same everywhere leaves the ranking unchanged, while a single store counted at the wrong camera angle can drop several places. Hold every store to the same camera standard and hand count a sample hour to confirm it.
Can We Keep Our Existing Door Counters?
Yes. ARSA does not require you to remove them, and most chains run both while they switch over. Running both for a few weeks also tells you how far the old and new counts differ at each store, so your historical figures stay comparable.
Can The System Track The Same Shopper Across Several Stores?
No. The module creates no face templates and cannot recognise a returning individual, so it cannot show which stores the same people visit or how often they come back. Loyalty card or app data is the usual source for that.
What Does It Cost To Benchmark 40 Stores?
With one AI Box Mini per store and three cameras each, it costs $75,600 in hardware plus $3,480 a month in licences. Running the software centrally on your own servers removes the hardware cost and keeps the same $29 per camera per month, as long as the store networks can carry the video to head office.
Does ARSA Deliver To Chains In The UK And Australia?
Yes. List prices are in USD, invoicing is in USD or EUR, and where visa conditions prevent ARSA engineers from travelling, a qualified local partner installs under ARSA supervision.
GET STARTED
Benchmark Every Store On The Same Footing
The Smart Retail Counter uses the cameras already at your entrances and tills to measure entries, queue waits and dwell times. Every store is measured to the same standard, and the results roll up into one dataset for the whole chain. See pricing, site requirements and the live demo on the Smart Retail Counter page.