
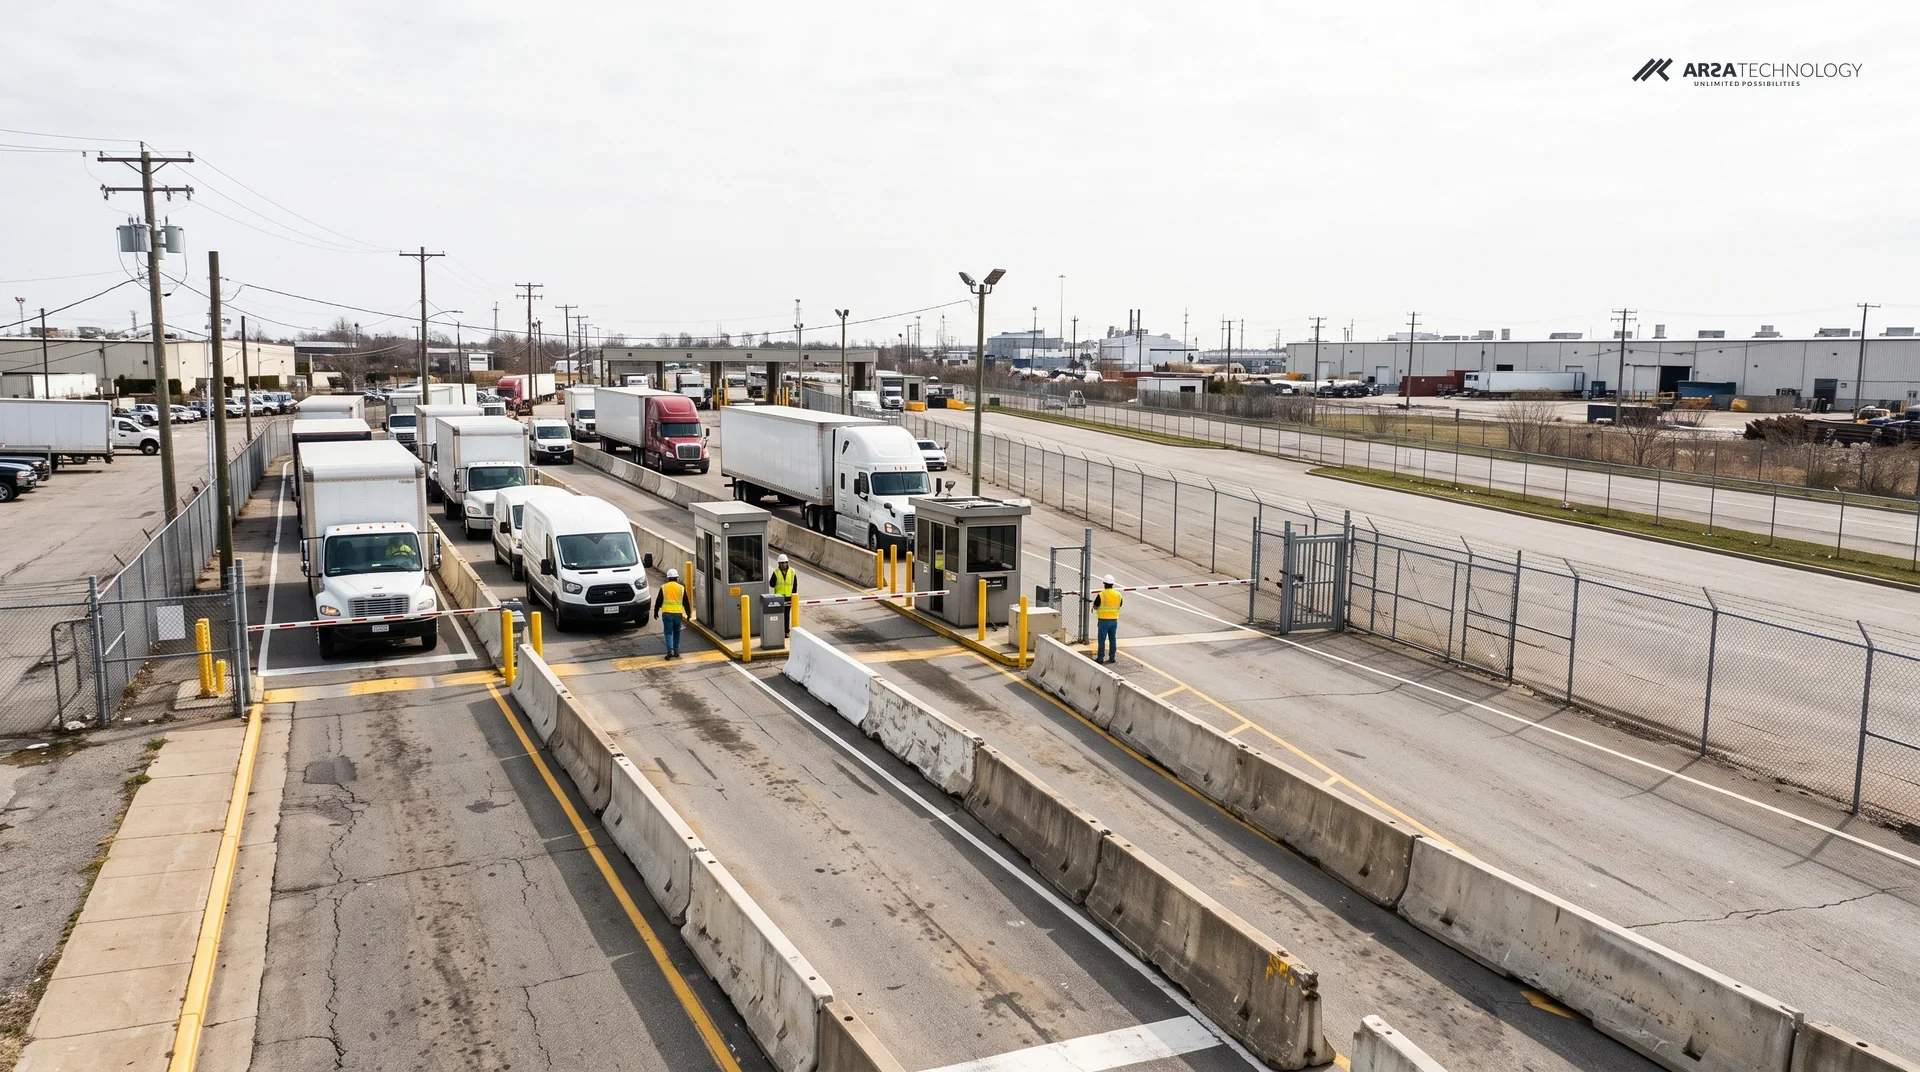

The Texas A&M Transportation Institute puts the cost of US congestion at $269 billion a year. That is up 16 percent over the last five years, and the average American lost 63 hours in traffic in 2024, the most it has ever measured. Inside a single country, city traffic varies widely: a 10 km drive took 32 minutes and 37 seconds in Bandung in 2024 and 15 minutes and 31 seconds in Jakarta. A city average says little about any one corridor, and counting at the corridor is how an operator turns a headline cost into a figure it can act on.
METHODOLOGY
How This Report Was Built
This report uses four published sources and ARSA’s own aggregate enquiry and search data. Every figure was checked on its source page before it was used.
The US figures come from the Texas A&M Transportation Institute, whose 2025 Urban Mobility Report, released in October 2025, analyzes travel in 494 U.S. urban areas and reports delay for 2024. The city travel times are TomTom Traffic Index results as reported by Katadata, covering 2024, and by Databoks (Katadata), covering 2022. We read the index through those reports and did not consult it directly. The regional cost estimate comes from The Jakarta Post, reporting a 2019 government study. The newest published figures available to this report describe 2024, so a 2026 reader should treat them as the latest baseline and expect current numbers to differ.
ARSA’s own data covers two things. The first is form enquiries to ARSA from April to October 2026, each counted once across every export, rounded to the nearest 5, with any count under 5 shown as “<5”. The second is Google Search Console queries, every export combined, using each query’s newest window total. Search impressions from 100 up are rounded to the nearest 10, and each export stops at 1,000 queries, so the search table is a sample. Neither dataset is a survey or a measure of market share. Both count only how people contacted or found ARSA.
FINDING ONE
US Congestion Now Costs $269 Billion A Year
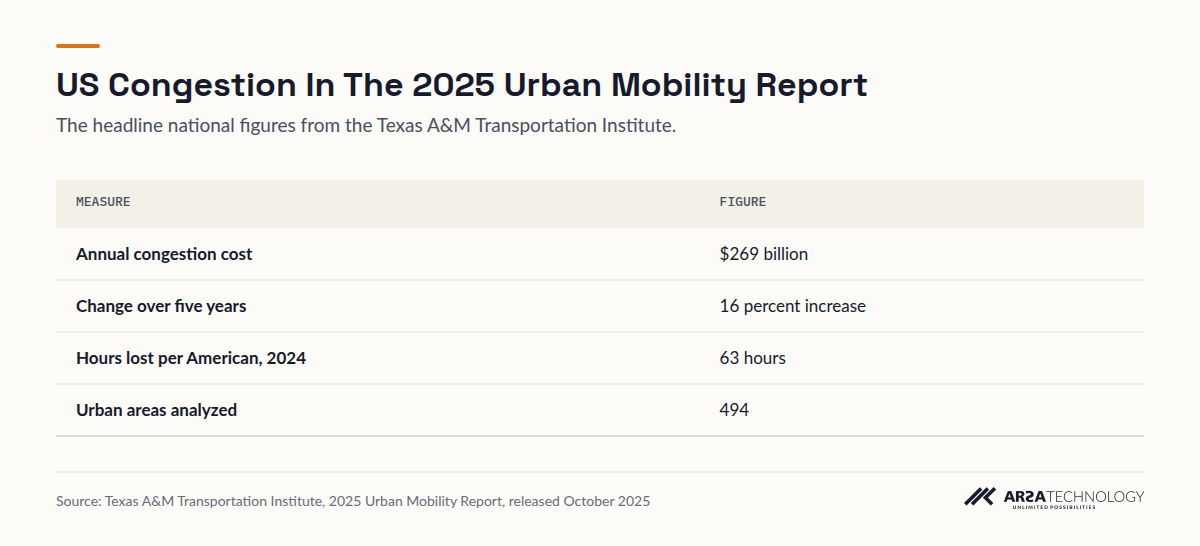
US national congestion costs total $269 billion annually, according to the Texas A&M Transportation Institute, a 16 percent increase over the last five years. The same report found that Americans lost an average of 63 hours in traffic in 2024, the highest level it has ever measured.
For a buyer, this is the top line of a business case: delay is a large cost and it is growing. The limit is scale. The figure is a national sum across 494 urban areas. It cannot say how much of that cost sits on a given arterial, at a given signal, or at the gate of a given distribution centre. A traffic authority or a site operator that wants to justify signal retiming, a new turning lane or a change in gate scheduling needs counts from its own approaches, broken down by direction, class and time of day.
View The Data
| Measure | Figure |
|---|---|
| Annual congestion cost | $269 billion |
| Change over five years | 16 percent increase |
| Hours lost per American, 2024 | 63 hours |
| Urban areas analyzed | 494 |
FINDING TWO
Travel Times For The Same 10 Km Differ Widely Between Cities In One Country
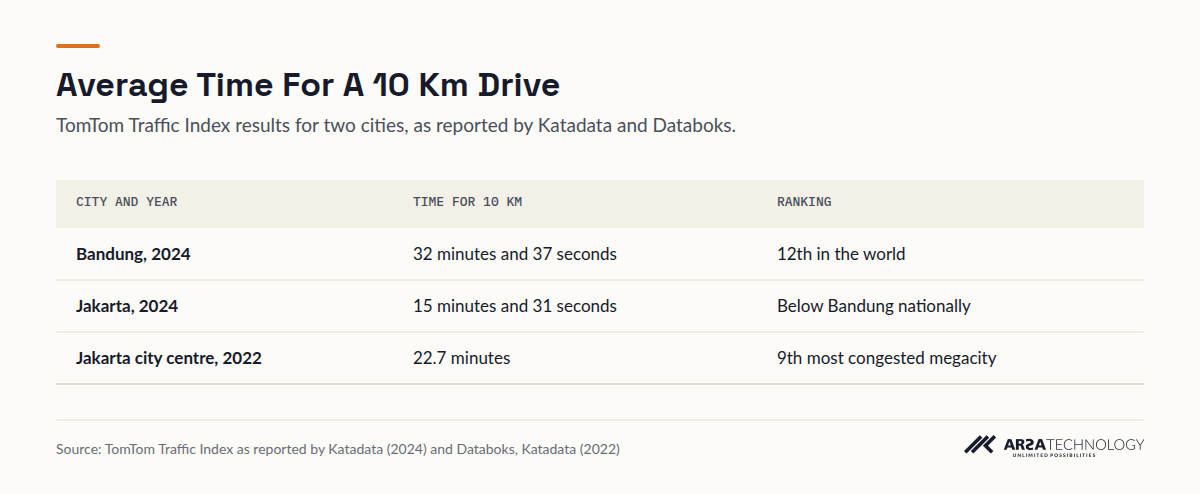
A 10 km drive in Bandung took 32 minutes and 37 seconds on average in 2024, compared with 15 minutes and 31 seconds in Jakarta, according to TomTom data reported by Katadata. Bandung ranked as Indonesia’s most congested city and 12th in the world overall. In 2022, Jakarta’s city centre averaged 22.7 minutes for the same distance and ranked as the 9th most congested megacity in the world, according to Databoks (Katadata).
The lesson carries to any market: neighbouring cities, and corridors within one city, behave very differently, and rankings move from year to year. Jakarta’s two figures come from different years and possibly different measurement areas, a city centre in 2022 against a citywide figure in 2024, so they show a change in ranking and cannot be read as a measured improvement. A buyer in Sydney, Manchester or Dubai should expect the same spread across their own network. That is why a business case built on a national index alone tends to fall apart in review.
View The Data
| City And Year | Time For 10 Km | Ranking |
|---|---|---|
| Bandung, 2024 | 32 minutes and 37 seconds | 12th in the world |
| Jakarta, 2024 | 15 minutes and 31 seconds | Below Bandung nationally |
| Jakarta city centre, 2022 | 22.7 minutes | 9th most congested megacity |
FINDING THREE
Travel Times Rose In 62% Of TomTom Cities As Offices Reopened
In 2022, with more workers returning to the office, travel times increased in 62% of the cities surveyed by the TomTom Traffic Index, according to Databoks (Katadata).
Congestion responds to changes in demand, such as work patterns, school calendars and freight schedules, and it can shift within a year. The Texas A&M Transportation Institute titles its 2025 release on commuters rewriting the rush hour for the same reason. A count taken once with a temporary tube or a manual survey describes a single week. A permanent camera count shows when the peak moves, which is the information needed to decide whether a signal plan or a shift start time still fits.
FINDING FOUR
Regional Estimates Put Congestion Losses In The Trillions Of Rupiah
Traffic congestion costs the Greater Jakarta region (Jabodetabek) some Rp 100 trillion a year in economic losses, according to a 2019 government study reported by The Jakarta Post.
Read beside the US figure, this shows that congestion cost estimates are produced by different bodies, for different areas, in different years and with different methods. We have not converted the rupiah figure to dollars or compared the two, because they were not built to be compared. A buyer should cite the estimate published for their own jurisdiction, name its year, and pair it with locally measured volumes.
FINDING FIVE
Searches For Vehicle Counting Far Outnumber Searches For Traffic Monitoring AI
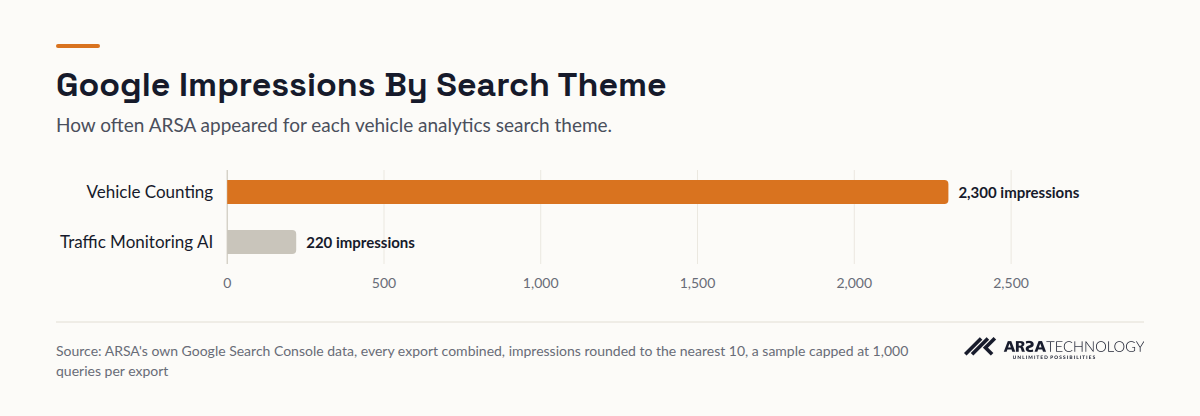
Queries on the vehicle counting theme drew 2300 impressions across 13 queries in ARSA’s own Google Search Console data, at an average position of 17.7. The traffic monitoring AI theme drew 220 impressions from fewer than 5 queries, at an average position of 7.0. Clicks were under 5 for both.
The searches people run name the job they need done, counting vehicles, more often than the technology. For a buyer writing a case internally, the useful framing is the same: state the counts you need and the decisions they feed, and treat the analytics as the means. The limits are significant. This is a sample of one vendor’s search exposure, capped at 1,000 queries per export, and it measures how often ARSA appeared, which is a different thing from the total volume of these searches.
View The Data
| Impressions | |
|---|---|
| Vehicle Counting | 2,300 impressions |
| Traffic Monitoring AI | 220 impressions |
FINDING SIX
Most Of ARSA’s Enquiries Name The Edge Appliance
Of about 80 form enquiries to ARSA between April and October 2026, 25 named the AI Box Series and 15 named AI Video Analytics Software, the two products that carry vehicle counting. The rest of the interest table is listed below as approved. The Self-Check Health Kiosk, which accounts for 15 enquiries, is sold only in Indonesia.
| Product Interest | Enquiries |
|---|---|
| AI Box Series | 25 |
| Self-Check Health Kiosk | 15 |
| AI Video Analytics Software | 15 |
| Custom AI Development | 10 |
| Other | 10 |
| General Enquiry | 5 |
| Face Recognition API | <5 |
| Face Recognition SDK | <5 |
| Web Application Development | <5 |
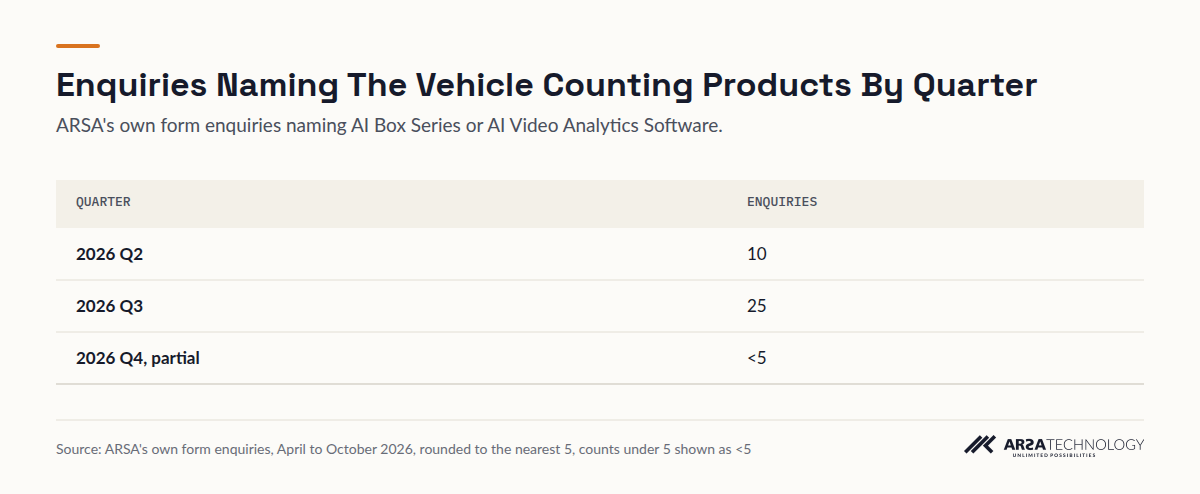
Among enquiries naming the AI Box Series or AI Video Analytics Software, 10 arrived in 2026 Q2, 25 in 2026 Q3, and fewer than 5 so far in 2026 Q4, which is a partial quarter. By region, 15 came from Indonesia and 15 could not be placed. Rest Of Southeast Asia, South Asia, Middle East And North Africa and Rest Of World each counted fewer than 5. Region is read from the calling code of the number given, or else the time zone.
These enquiries cover every module on that hardware, and the count does not separate traffic work from safety or retail work. The data shows only that buyers ask most often about the appliance, which processes video at the site.
View The Data
| Quarter | Enquiries |
|---|---|
| 2026 Q2 | 10 |
| 2026 Q3 | 25 |
| 2026 Q4, partial | <5 |
COST OF MEASUREMENT
What A Counting Deployment Costs Against The Cost Of Delay
ARSA publishes list prices for vehicle counting, so a buyer can put a measurement cost next to a congestion estimate before talking to sales. All prices are international list prices in USD, and invoicing is available in USD or EUR.
| Option | Capacity | List Price |
|---|---|---|
| AI Box Mini A, one-time, Traffic Monitor | Up to 3 cameras | $5,190 |
| AI Box Server 12 A, one-time | Up to 12 cameras | $19,900 |
| AI Box Server 25 A, one-time | Up to 25 cameras | $39,900 |
| AI Box Mini hardware, subscription | Up to 3 cameras | $1,890 plus $39 per camera per month |
| Traffic Monitor software, self-hosted | Four-camera minimum | $39 per camera per month, billed annually, or $1,170 perpetual per camera |
| Plate recognition add-on, subscription | Per lane | +$20 per month |
| Remote Camera Design Review | One week | $1,500 |
| Pilot | Bounded scope | $20,000 |
A one-time purchase includes 12 months of updates, support and warranty, and Care is optional from year 2 at 18% of the unit price. The review and pilot fees are deducted from the project fee if the project is contracted within 90 days.
The software route suits networks whose video already reaches a control centre. The appliance sits in the roadside cabinet where there is no backhaul and pushes only the counts upstream through an API, so no video has to cross the network. Under ARSA-CVS-001, counting needs 67 PPM, which a 2 MP camera with a 60 degree lens reaches out to 24.9 m. Classification needs 107 PPM, reached out to 15.6 m. The scene needs at least 10 lux for counting and 20 lux for classification. Many existing road cameras qualify, and the guide to using existing CCTV for traffic analytics covers how to check yours. ARSA delivers outside Indonesia. Where visa conditions prevent ARSA engineers from travelling, a qualified local partner installs under ARSA supervision.
LIMITS
What The Data Does Not Show
None of these sources measures the return on a counting system, and this report does not estimate one. They show that delay is costly and uneven, which justifies measuring it, and the benefit of acting on the counts has to be measured at your own site.
Cost Is A Different Measure From Benefit
The congestion estimates price lost time across whole regions. A buyer who claims a share of that saving needs before and after counts on the corridor that changed. A citation of the national figure cannot stand in for them.
City Indices Average Away Your Corridor
TomTom figures describe a city’s average 10 km trip. A port access road, a school zone or a warehouse gate can sit far above or below its city’s average, and only local counts show which.
ARSA’s Data Is Small And Partial
About 80 enquiries and a capped search sample describe interest in one vendor. They say nothing about market size, and many of the cells are suppressed as “<5” for that reason.
FAQ
Questions Buyers Ask About Congestion Data And Vehicle Counting
How Much Does Traffic Congestion Cost In The United States?
US congestion costs total $269 billion annually, according to the Texas A&M Transportation Institute’s 2025 Urban Mobility Report. That is a 16 percent increase over five years, and the average American lost 63 hours in traffic in 2024.
Where Can I Find Traffic Congestion Cost Data For My City?
Start with the estimate published for your own jurisdiction and note its year, because estimates differ in method and area. The Texas A&M Transportation Institute covers 494 U.S. urban areas, and the TomTom Traffic Index ranks cities worldwide by travel time. Pair either one with counts from the roads you manage.
Can Existing CCTV Cameras Be Used For Vehicle Counting?
Often, yes, when the camera meets the pixel density, angle and light the analytic needs. Under ARSA-CVS-001, a 2 MP camera with a 60 degree lens counts vehicles to 24.9 m and classifies them to 15.6 m, with an optimal tilt of 15 to 35 degrees for counting and at least 10 lux at the target.
Does A Vehicle Counting System Need Licence Plate Recognition?
No. Counting, classification and congestion state run without reading plates. Plate recognition is a separate add-on, offered only where it is lawful, which matters for buyers working under UK GDPR, Singapore’s PDPA or the UAE’s PDPL.
What Does An AI Vehicle Counting System Cost?
A three-camera AI Box Mini A with Traffic Monitor lists at $5,190 one-time, or $1,890 for the hardware plus $39 per camera per month on subscription. Self-hosted software is $39 per camera per month, billed annually, with a four-camera minimum.
NEXT STEP
Measure The Corridor Behind Your Business Case
National indices make the case that congestion costs money. Your own counts by direction, class and hour show where it costs you. Traffic Monitor produces those counts from cameras you already have, at the pole or on your own server, with the video kept on your network. Start with a Remote Camera Design Review at $1,500, which is credited to the project if you contract within 90 days.