

A Complete Guide to Customer Heatmap Analytics for Store Layout Optimization
In the competitive landscape of 2026 retail, understanding how customers interact with your physical space is no longer a luxury—it’s a necessity. For mall property managers, optimizing tenant performance and enhancing the overall shopping experience hinges on precise insights into shopper behavior. This guide delves into the transformative power of customer heatmap analytics for store layout optimization, revealing how this technology can unlock significant business outcomes for convenience stores and beyond.
Traditional retail planning often relies on intuition or anecdotal evidence. However, with advanced AI video analytics, businesses can now leverage objective data to make informed decisions. ARSA Technology, a leader in AI video analytics and edge AI systems, offers solutions like the ARSA Smart Retail Counter (AI Box), designed to provide these critical insights with a 5-minute plug-and-play setup. This edge computing device processes video streams locally, ensuring privacy and delivering real-time operational intelligence without cloud dependency.
The Power of Customer Heatmap Analytics for Store Layout Optimization
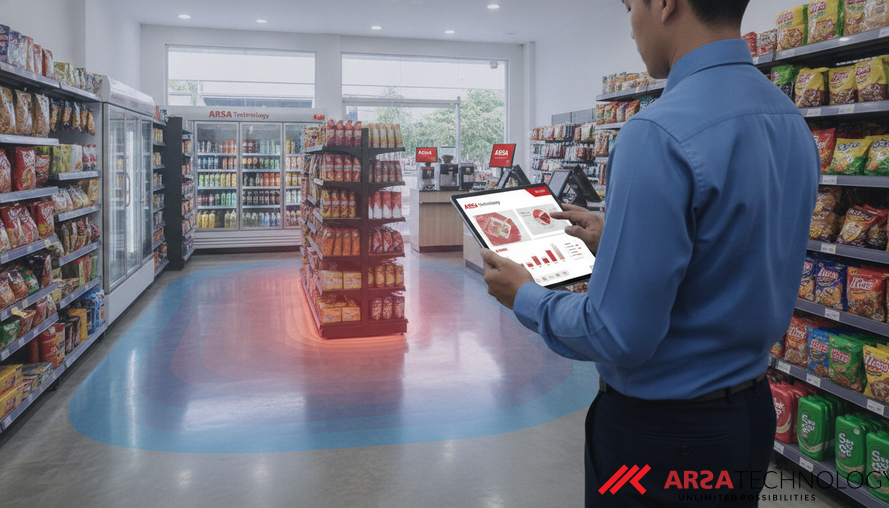
Customer heatmap analytics provides a vivid, color-coded visualization of shopper presence and dwell time across a store’s floor plan. Warm colors indicate high activity and prolonged stops, while cool colors highlight areas that shoppers tend to bypass. This visual data is invaluable for identifying popular zones, understanding traffic flow, and pinpointing “dead zones” that may be costing sales. According to Ariadne Inc., modern heatmaps are built from anonymous footfall and dwell data captured by ceiling sensors, not cameras, ensuring privacy and updating in near real-time. This anonymized approach is crucial for maintaining a clean data privacy posture, such as compliance with GDPR or CCPA requirements, as no personal identifiable information (PII) or biometric data is stored.
For convenience stores, where every square foot counts, optimizing the retail floor plan with heatmap data can directly impact sales conversion and operational efficiency. By observing where customers pause, which aisles they frequent, and where bottlenecks occur, managers can strategically rearrange product displays, promotional signage, and even checkout counters to guide shoppers more effectively and encourage impulse purchases.
How AI Dwell Time Analysis Transforms Retail Spaces
Beyond simply showing where people are, AI dwell time analysis measures the exact duration a shopper spends within a defined zone. This metric is a powerful indicator of customer engagement and interest. For a mall property manager, understanding dwell time in various sections of a convenience store can reveal which product categories or promotions truly capture attention. For instance, a high dwell time around a new snack display suggests strong interest, while low dwell time in a typically high-value area might signal a merchandising problem.
ARSA’s Smart Retail Counter leverages this capability, providing detailed insights into how long customers engage with specific products or displays. This allows for data-driven decisions on product placement, promotional effectiveness, and even staffing levels to ensure adequate assistance in high-dwell areas. This deep understanding of customer behavior is a significant step beyond traditional people counting, offering actionable intelligence to improve the customer journey. You can learn more about measuring retail conversion rates with AI analytics in our blog post, A Complete Guide to How to Measure Retail Store Conversion Rate with AI Analytics.
Leveraging Customer Movement Pattern Analysis with CCTV
While modern heatmap solutions prioritize privacy by using anonymous sensors, existing CCTV infrastructure can be transformed into a powerful data source for customer movement pattern analysis. ARSA’s AI Box Series integrates seamlessly with existing ONVIF/RTSP CCTV cameras, converting passive video feeds into active intelligence. This means your current security cameras can do double duty, providing crucial insights into how customers navigate your store without requiring a complete overhaul of your infrastructure.
The ARSA Smart Retail Counter, part of the robust AI Box Series overview, performs this analysis at the edge. This means all video streams are processed on-device, and only anonymized data—like counts, paths, and dwell times—leaves the network. This privacy-first approach, based on skeleton/keypoint tracking rather than facial recognition, ensures that customer privacy is maintained while still delivering comprehensive insights into footfall, queue management, and overall store flow.
Practical Steps to Optimize Retail Floor Plan with Heatmap Data
Optimizing a retail floor plan with heatmap data involves a systematic approach:
1. Identify Hotspots and Cold Zones: Use heatmap visualizations to clearly see areas of high and low activity. Hotspots might indicate popular products or bottlenecks, while cold zones could be underperforming areas or intentional negative space.
2. Analyze Dwell Times: Correlate hotspots with dwell time data. High traffic with low dwell time might mean customers are passing through but not engaging. High traffic with high dwell time indicates strong engagement.
3. Trace Customer Journeys: Observe common customer movement patterns. Are shoppers following a logical path? Are they missing key displays? This helps in understanding the natural flow and identifying opportunities for re-routing.
4. Test and Iterate: Implement small changes to your store layout based on your analysis. For example, move a popular item to a cold zone to draw traffic, or reconfigure a bottleneck area. Then, use the heatmap analytics to measure the impact of these changes.
5. Monitor Queue Performance: Heatmaps can highlight queue formation hotspots, distinguishing between high volume and service-throughput problems. This insight is critical for reducing queue abandonment and improving customer satisfaction. Our article, Reduce Queue Wait Times in Retail with AI Video Analytics, offers further guidance on this.
By continuously monitoring and adapting your layout based on these insights, you can create a more intuitive and profitable shopping environment.
Foot Traffic Analytics for Enhanced Tenant Performance
For mall property managers, foot traffic analytics for tenant performance is a key metric. Understanding not just total visitors, but also their paths and engagement within individual stores, provides concrete data to support tenants in optimizing their spaces and demonstrating value. Heatmap data can help tenants identify prime locations for new product launches, optimize promotional displays, and even adjust staffing based on peak traffic hours.
The ARSA Smart Retail Counter provides these granular insights, enabling mall managers to offer data-backed recommendations to their tenants, fostering a more collaborative and profitable ecosystem. This level of detail helps tenants understand their true conversion potential and allows for strategic placement of new stores or pop-ups based on observed customer flow. The ability to track visitor footfall and conversion rates across different areas of a mall or within specific stores is a powerful tool for maximizing revenue for both tenants and property managers.
Modern retail analytics, as highlighted by ClariBI, extends beyond simple sales reports to encompass customer journey analysis, real-time inventory optimization, and predictive demand forecasting. This data-driven approach is essential for retailers to gain a competitive edge in 2026. For instance, stockouts can cost retailers up to 4% of annual revenue, making efficient inventory management, informed by foot traffic and dwell time, critical. Similarly, with an average cart abandonment rate of approximately 70%, optimizing store flow and reducing friction points identified by heatmaps can significantly boost conversion.
Conclusion
The ability to effectively utilize customer heatmap analytics for store layout optimization is a game-changer for mall property managers and convenience store owners. By transforming raw video data into actionable intelligence, solutions like the ARSA Smart Retail Counter empower businesses to make data-driven decisions that enhance customer experience, boost sales conversion, and optimize operational efficiency. With its edge computing, privacy-first design, and plug-and-play setup, ARSA Technology provides a practical and powerful tool for navigating the complexities of modern retail.
Ready to transform your retail space with intelligent analytics? Explore all ARSA products, including the ARSA Traffic Monitor (Software) for broader video analytics needs, or contact ARSA solutions team today to discuss how our AI Box Series can help you optimize your store layout and drive measurable results. For more insights into retail optimization, check out our article on Unlocking QSR Profitability: Leveraging Customer Heatmap Analytics for Store Layout Optimization.
FAQ
What is customer heatmap analytics and how does it help optimize retail floor plans?
Customer heatmap analytics is a visual representation of customer movement and dwell time within a physical store, using color-coded maps. It helps optimize retail floor plans by highlighting high-traffic areas, popular product displays, and underperforming zones, enabling managers to make data-driven decisions on layout adjustments, product placement, and staffing to improve customer flow and sales.
How does AI dwell time analysis for shopping malls contribute to better store layouts?
AI dwell time analysis measures how long customers spend in specific areas or looking at particular products. For shopping malls, this data helps tenants understand customer engagement with displays and promotions. This insight allows them to refine their store layouts to maximize interaction with high-interest items, reduce queue wait times, and ultimately drive higher conversion rates.
Can existing CCTV systems be used for customer movement pattern analysis?
Yes, existing CCTV systems can be integrated with AI video analytics solutions, such as ARSA’s AI Box Series, to perform customer movement pattern analysis. These systems process video feeds at the edge, converting them into anonymized data on footfall, paths, and dwell times, without storing personal identifiable information. This transforms passive surveillance into actionable retail intelligence.
What are the key benefits of using foot traffic analytics for tenant performance?
Foot traffic analytics provides mall property managers and tenants with objective data on visitor numbers, movement patterns, and engagement within stores. Key benefits include optimizing store layouts, identifying prime locations for new tenants or promotions, improving labor scheduling, reducing queue abandonment, and ultimately increasing sales conversion and overall tenant profitability.
Stop Guessing, Start Optimizing.
Discover how ARSA Technology drives profit through intelligent systems.