
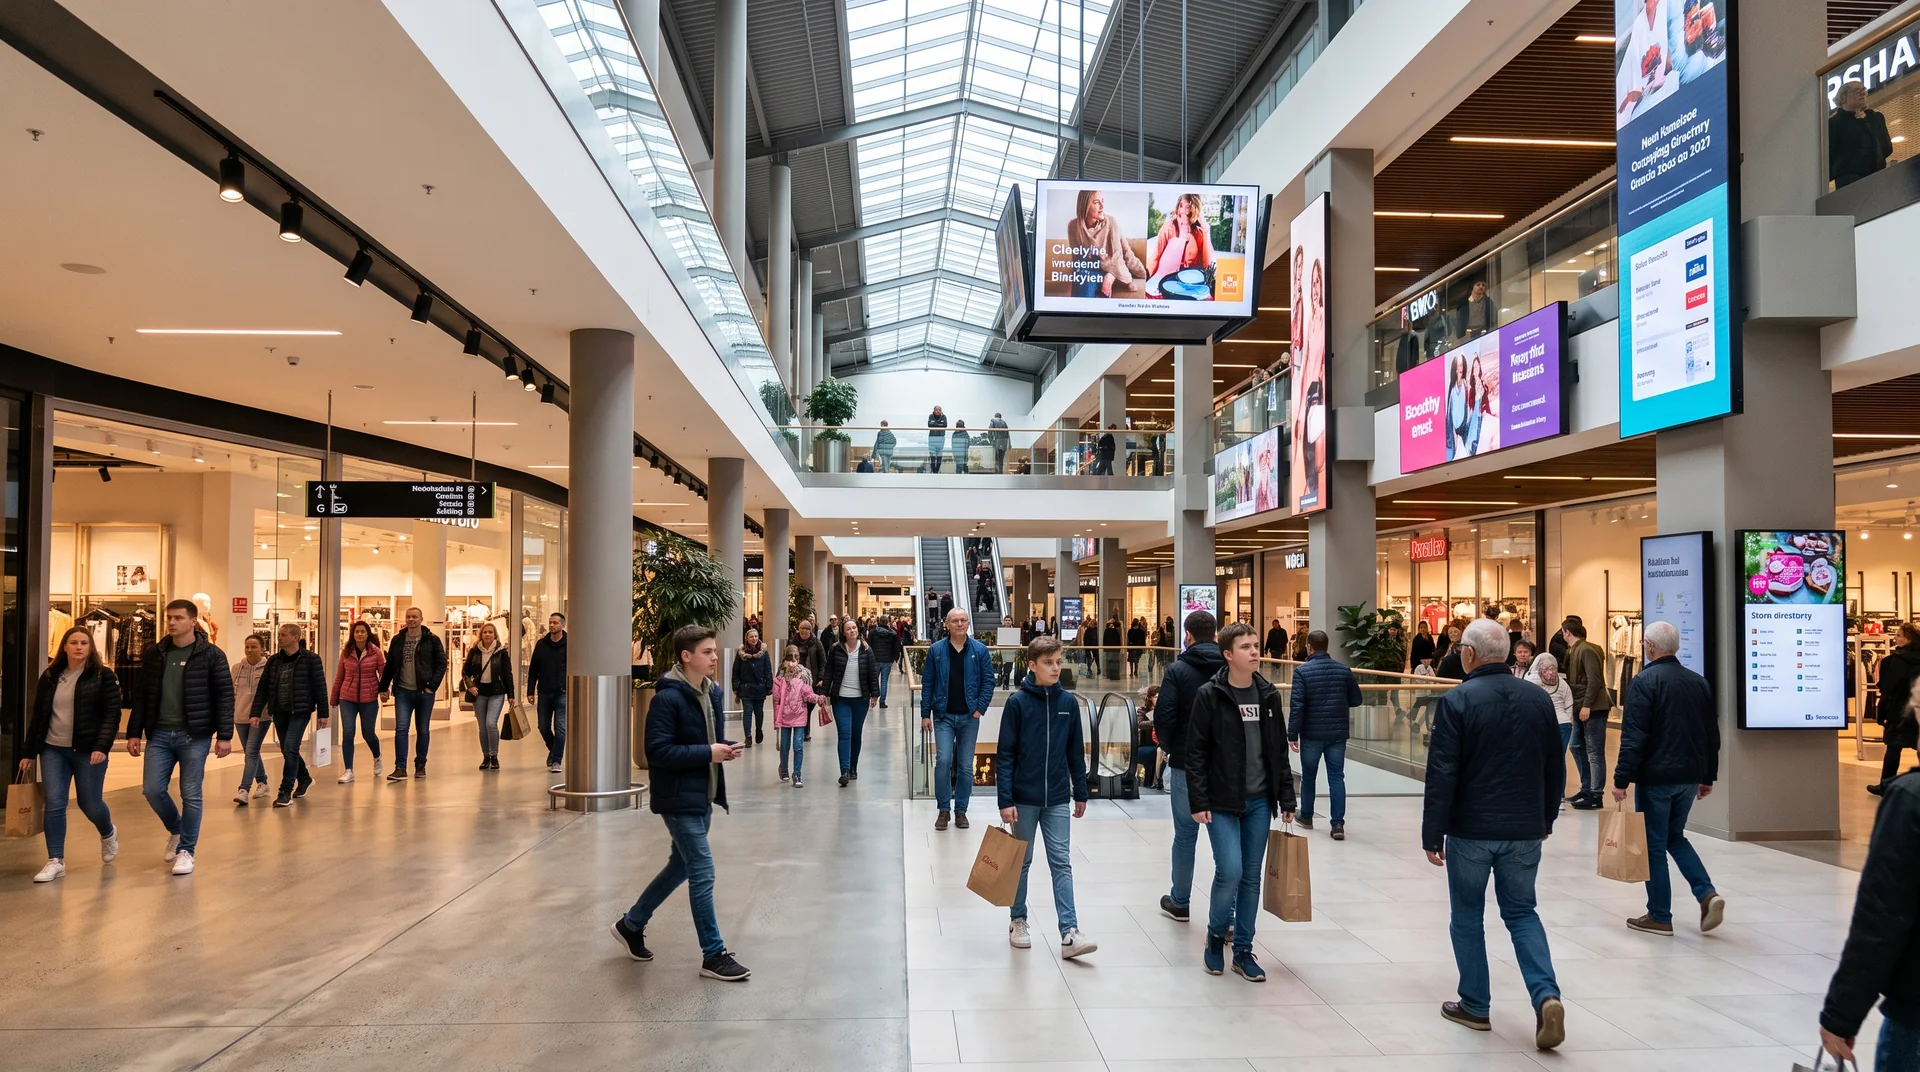

A media owner with 200 screens usually knows which ones sell out first. It rarely has measured evidence for why. Comparing audience data screen against screen tells you which locations justify a premium CPM, which ones are underpriced, and where the next screen should go. That only works if every screen is measured the same way.
THE QUESTION
Why Network Comparison Is A Different Question From Campaign Reporting
To compare audiences across a network, you measure every instrumented screen with the same definitions and over the same time windows. Then you rank the screens against a fair baseline for their environment type. Campaign reporting answers an advertiser’s question about one flight. Network comparison answers the owner’s own question about which inventory is worth more.
The stakes are growing. The OAAA put US out-of-home revenue at a record $9.46 billion in 2025, with digital screens making up 36.3% of it and growing 10.5% year over year, as reported by MediaPost. Buyers are moving to impression-based trading, so the audience behind each play now sets the price. In the UK, the OUTSMART impression multiplier standard defines the multiplier as impacts divided by spots over a period, with impacts drawn from Route. Broadsign describes the multiplier as tailored to each screen. In both cases a screen’s own measured audience is what moves its number. A network that has measured some of its screens can defend its rate card with its own data. One that has not has to lean on modelled estimates.
Proving delivery to an advertiser after a flight is a separate job, covered in our article on DOOH proof of play and campaign verification. This article is about the owner’s view of its whole estate.
WHAT TO COMPARE
Three Numbers That Compare Fairly Between Screens
Three measures can be compared between screens: impressions per hour, attention rate and audience mix. ARSA’s DOOH Audience Meter produces the raw counts for each one, aggregated by time window, and none of them needs an image stored or an identity created.
Impressions Per Hour
An impression, or opportunity to see, is logged when a face is detected inside the screen’s calibrated measurement cone, facing the display. Raw daily totals favour screens with longer operating hours. Divide by the hours the screen was actually playing before you compare a 24-hour transit screen with a mall screen that switches off at 10 pm.
Attention Rate
Attention means a sustained frontal look at the display, held past a configured threshold, typically 1.0 to 1.5 seconds. A brief glance counts as an impression only. Attention divided by impressions gives a ratio that is roughly independent of footfall, so a quiet screen that holds its viewers can rank above a busy one that people walk past.
Audience Mix
The meter estimates age band and gender for the audience as a whole and reports only the aggregate. For sales planning, the mix by daypart is what matters. A screen whose weekday lunchtime audience skews toward working-age adults can be packaged for advertisers who want that audience, at a rate the averaged daily figure would never support.
FAIR BASELINE
Making Screens Of Different Sizes And Positions Comparable
Screens are comparable when each one meets the same measurement conditions, so that differences in the numbers reflect differences in the audience and nothing else. A screen where the camera only resolves faces to 3 metres will undercount against one that resolves them to 8, however busy each location is.
The governing figure is pixel density at the far edge of the detection zone. ARSA’s camera and site standard, ARSA-CVS-001, sets 400 PPM for audience exposure counting, and the distance that delivers it depends on camera resolution:
| Parameter | Value |
|---|---|
| Required pixel density | 400 PPM at the far edge of the detection zone |
| Maximum viewing distance, 60 degree lens | 4.2 m at 2 MP, 5.5 m at 4 MP, 6.7 m at 6 MP, 8.3 m at 8 MP |
| Camera angle below horizontal | 0 to 15 degrees optimal, 25 degrees maximum |
| Minimum light at the face plane | 30 lux |
| Camera facing outdoor light | WDR 120 dB required |
| Clearance behind the display | 60 mm minimum for the AI Box Mini |
| Attention threshold | Configurable, typically 1.0 to 1.5 seconds |
In practice, write one measurement specification and apply it across the whole network: the same detection depth, the same attention threshold and the same reporting windows. A large roadside screen read from 20 metres away will have most of its viewers outside any 8 metre zone. Report it as its own class, and compare it only with screens of the same class. Within a class, index each screen against the class median. A score of 140 then means the screen delivers 40% more attention per hour than a typical screen of its kind.
SAMPLING
Instrumenting A Representative Sample
You do not need a meter on every screen. Most networks instrument 10% to 15% of their screens, chosen across environment types, and extrapolate to the rest. On a 200-screen estate, that means 20 to 30 instrumented screens.
The sample has to cover the variation you intend to price. If the network spans malls, transit concourses, office lobbies and roadside sites, put meters in each type, and include both your best and worst performers in each. A sample made up only of flagship locations will inflate the baseline and underprice everything else. Leave meters in place for at least a full seasonal cycle before rewriting a rate card on them, because holiday trading and school terms shift audiences by daypart.
FROM DATA TO RATE CARD
Turning The Comparison Into Pricing And Placement Decisions
The output is a ranked table of screens by class, with each screen’s index for impressions per hour, attention rate and audience mix by daypart. Three decisions follow from it.
First, tiering. Screens indexing well above their class median on attention can carry a premium CPM, and the measured attention figure is the evidence a buyer will ask for. Second, packaging. Screens with similar audience mixes in the same daypart can be sold together as a single audience package, even when they sit in different venues. Third, placement. A consistently low screen in a strong venue usually points to the screen’s position, sightline or height. A low screen in a weak venue is a candidate to move.
Data leaves the meter as CSV or PDF exports, or through a REST API, webhooks and an MQTT broker on the software platform. That lets you build the index in the reporting tools your sales team already uses. ARSA supplies the measured counts. The rate card logic and the extrapolation model belong to you, and you should be able to explain both to a buyer.
COST
What A Network Measurement Programme Costs
A sample of about 24 screens costs roughly $30,000 to $40,000 one-time at list price, depending on how many of the screens have fixed broadband. Prices are in USD, invoicing is available in USD or EUR, and every DOOH product is sold outside Indonesia.
Screens on 4G each need their own DOOH Node, which costs $2,590 one-time with a perpetual licence. Alternatively, buy the $1,890 AI Box Mini hardware and subscribe at $25 per screen per month. Screens on fixed broadband can stream to a central AI Box Server 25, at $29,900 one-time or $10,900 plus $25 per screen per month. Each attention-grade stream uses roughly 1.3 to 2.6 TB per month, which is why the central route needs fixed lines. If you already run servers with a suitable GPU, the self-hosted software costs $25 per screen per month or $750 perpetual per camera, with a four-camera minimum. Twenty fibre-connected screens on a Server 25 plus four 4G screens on Nodes comes to $40,260 one-time.
Before buying, a Remote Camera Design Review at $1,500 checks each proposed camera position against ARSA-CVS-001. The fee is deducted from the project fee if you contract within 90 days. Where visa conditions prevent ARSA engineers from travelling, a qualified local partner installs under ARSA supervision.
LIMITS
What The Data Will Not Tell You
The meter counts faces that look toward a screen. It does not log playout or screen status, recognise individuals, or link exposure to purchases. Attribution to a specific creative depends on mapping the measurement to your playout schedule. Screens with no meter are estimated by your own extrapolation, and buyers should be told which figures were measured and which were inferred.
Aggregate counts with no stored images simplify privacy work, but they do not remove it. Signage and notice duties stay with the operator and vary by jurisdiction: UK GDPR, Singapore’s PDPA, the UAE’s PDPL and Australia’s Privacy Act each set their own expectations for camera-based measurement in public places. Check them before the first meter goes live.
Frequently Asked Questions
How Comparable Is Audience Data Across Different Screen Sizes And Locations?
It is comparable within a screen class whose members share the same measurement specification. Detection depth is set by camera resolution and the 400 PPM requirement, so a large roadside screen and a lobby screen measure different shares of their real audiences. Group screens by environment and viewing distance, then compare each against its own class median.
What Counts As A Fair Baseline For Benchmarking DOOH Screens?
The median screen of the same environment type, measured over the same dayparts and the same season. Normalise impressions by hours of play, use attention divided by impressions as the ratio, and let at least a full trading cycle pass before treating the baseline as settled.
How Do I Justify A Premium CPM To Advertisers?
Show the screen’s measured attention rate and audience mix against its class median, alongside how the figures were measured. Buyers trading on impressions want evidence for the audience behind each play, and a measured index from an instrumented screen carries more weight than a modelled estimate.
Do I Need A Meter On Every Screen To Compare A Network?
No. Most networks instrument 10% to 15% of their screens across every environment type and extrapolate to the rest. The sample needs both strong and weak screens in each type, or the baseline will be biased.
Can Measurement Data Feed My Existing Reporting Tools?
Yes. The software delivers data through a REST API, webhooks and an MQTT broker, and exports CSV and PDF reports. The appliance aggregates impressions and attention by time window and pushes them to your reporting stack, so the indexing can run wherever your sales team already works.
Measure The Screens That Set Your Prices
The DOOH Audience Meter mounts behind the display, measures impressions, attention and anonymous audience mix on the device, and reports by time window across your estate. See specifications, site requirements and pricing on the DOOH Audience Meter page.