
DOOH
Digital screens took 47% of the $54.2 billion spent on out of home advertising worldwide in 2025, according to the World Out of Home Organization, which forecasts that share will reach 49% in 2026. In the two largest English-speaking markets, the digital side is growing faster than the traditional side. US digital out of home revenue rose 12.9% in the first quarter of 2026, and UK digital revenue rose 14.6% in the second quarter. When this much spend moves onto screens, advertisers and network operators ask for more evidence of who actually saw an advert, and public standards for measuring that audience at the screen are still young.
KEY FIGURES
Digital Out Of Home Advertising Growth Statistics At A Glance
The table below lists every figure in this report, with the period it covers and the publisher that released it. All figures are revenue or spend. None of them measures audience.
| Figure | Value | Period | Source |
|---|---|---|---|
| Global out of home spend | $54.2 billion, up 15% on 2024 | 2025 | WOO |
| Global out of home spend, forecast | $56.4 billion | 2026 | WOO |
| Global digital out of home spend | $25.5 billion, 47% of out of home | 2025 | WOO |
| Global digital out of home spend, forecast | $28 billion, 49% of out of home | 2026 | WOO |
| Global programmatic digital out of home | About $1.4 billion, 7% of digital out of home | 2025 | WOO |
| US out of home revenue | $2.12 billion, up 7.1% year on year | Q1 2026 | OAAA |
| US digital out of home revenue growth | 12.9% year on year, 36% of out of home | Q1 2026 | OAAA |
| US consecutive quarters of growth | 20 | To Q1 2026 | OAAA |
| UK out of home revenue | £402.6 million, up 12.7% year on year | Q2 2026 | Outsmart |
| UK digital and classic out of home growth | 14.6% and 8.8% year on year | Q2 2026 | Outsmart |
METHODOLOGY
Methodology
The report uses six public sources, each read on its own page. Four of them report spend or revenue, and two describe how audiences are measured.
Global figures come from the World Out of Home Organization's global expenditure report, which gives actual spend for 2025 and a forecast for 2026, and from its first global study of programmatic digital out of home spend, published on 5 June 2026 and covering 2025. US figures come from the Out of Home Advertising Association of America's (OAAA) first quarter 2026 release, published on 3 June 2026. UK figures come from Outsmart's second quarter 2026 release, published on 3 September 2026. On measurement, the report uses OAAA's measurement resource page and a 2021 academic paper, "Benchmark for Anonymous Video Analytics", a preprint of an article published in the EURASIP Journal on Image and Video Processing.
The national figures cover different quarters and are reported in different currencies, so they cannot be added together or compared directly. Growth rates are year on year, as each publisher states them. This report adds no estimates or derived figures of its own.
FINDING ONE
Digital Screens Took 47% Of Global Out Of Home Spend In 2025
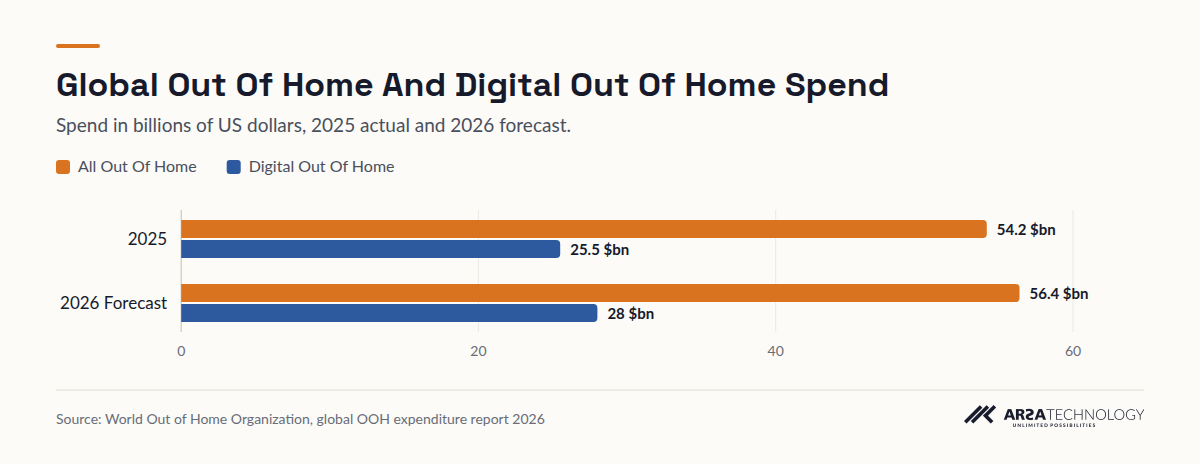
The World Out of Home Organization puts global digital out of home spend at $25.5 billion in 2025, or 47% of the $54.2 billion spent on out of home overall. Total spend rose 15% on 2024. WOO forecasts total spend of $56.4 billion in 2026, with digital reaching $28 billion.
View The Data
| All Out Of Home | Digital Out Of Home | |
|---|---|---|
| 2025 | 54.2 $bn | 25.5 $bn |
| 2026 Forecast | 56.4 $bn | 28 $bn |
For a network operator, the scale matters because digital inventory gets sold in ways that static billboards rarely are: by time slot, by daypart, and increasingly by audience. Each of those ways of selling raises the question of who was in front of the screen. For an advertiser, $25.5 billion is enough budget for finance teams to start asking the same evidence questions they ask of online media.
The limits are plain. The 2026 figure is a forecast, and WOO's global total combines markets with very different levels of digital penetration and reporting quality. Spend shows where money went. It says nothing about the audience that money reached.
FINDING TWO
Digital Is Forecast To Pass Static Formats Globally In 2026
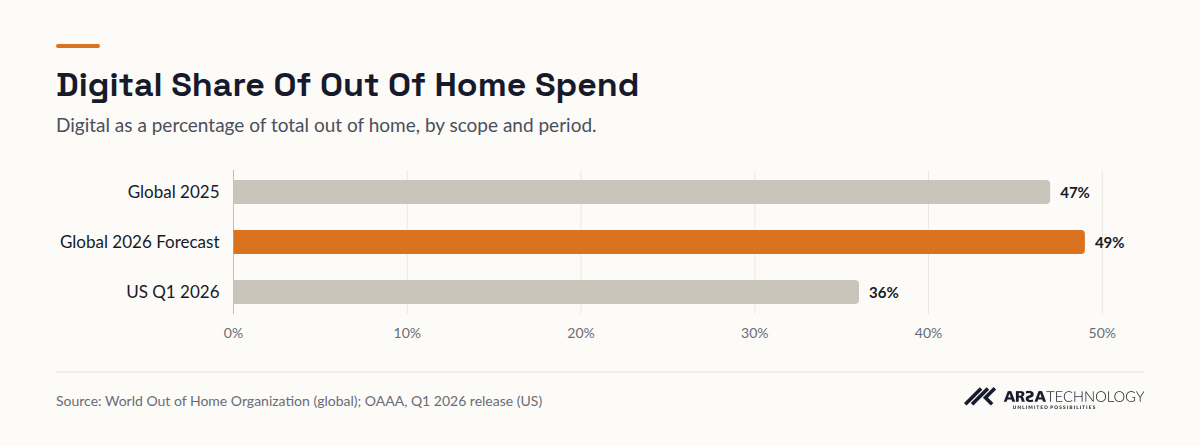
WOO forecasts digital will account for 49% of global out of home spend in 2026, and it describes this as the year digital overtakes static formats for the first time. In the United States, OAAA reports digital at 36% of total out of home revenue in the first quarter of 2026.
View The Data
| Digital Share | |
|---|---|
| Global 2025 | 47% |
| Global 2026 Forecast | 49% |
| US Q1 2026 | 36% |
The two sources point in the same direction but sit far apart, and they measure different things. WOO's figure is a full-year global forecast. OAAA's is one quarter in one market, and the US has a large estate of roadside static inventory. Read together, they suggest that the US share is below the global share. That is an inference from two differently scoped reports, and neither publisher draws that comparison itself.
A planner should take a practical point from this. Once more than half of a category's money goes to screens, the measurement conventions of the screen side start to set expectations for the whole category.
FINDING THREE
US Digital Out Of Home Revenue Grew 12.9% In The First Quarter Of 2026
OAAA reports that US out of home revenue reached $2.12 billion in the first quarter of 2026, up 7.1% year on year and a first quarter record. Digital out of home revenue grew 12.9%. The quarter extended the industry's growth streak to 20 consecutive quarters.
The gap between 12.9% for digital and 7.1% for the whole medium shows digital pulling the total up. Twenty quarters of growth also takes in the post-pandemic recovery, so part of the streak reflects that rebound as well as structural change. OAAA's headline also credits AI brands as advertisers in the quarter. That tells us which categories are spending. It does not show how the inventory was bought or measured.
FINDING FOUR
UK Digital Out Of Home Revenue Grew 14.6% In The Second Quarter Of 2026
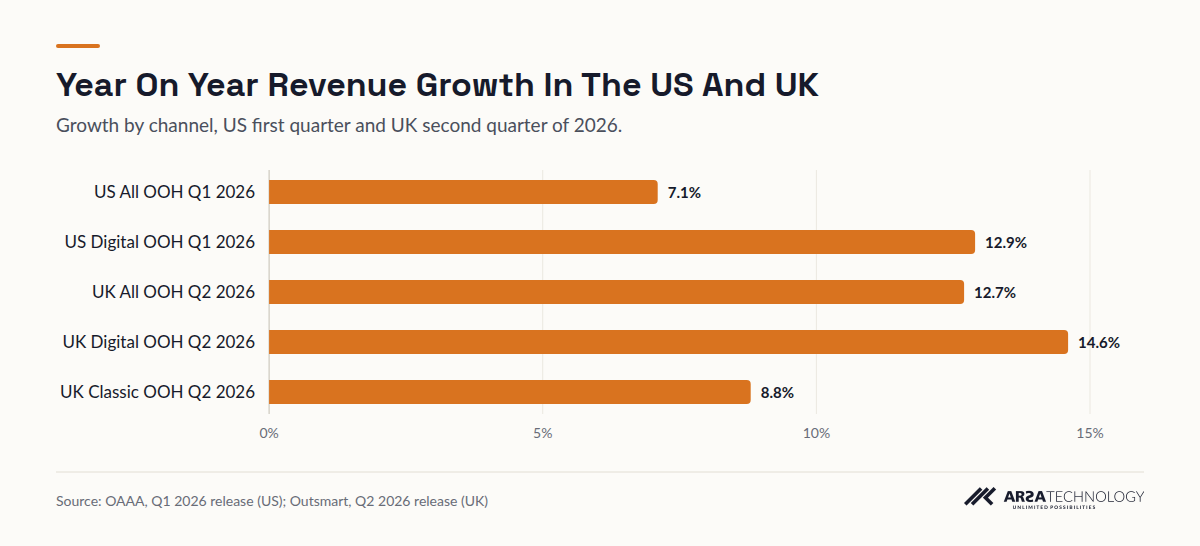
Outsmart reports UK out of home revenue of £402.6 million in the second quarter of 2026, up 12.7% year on year. Digital grew 14.6% and classic out of home grew 8.8%.
View The Data
| Growth | |
|---|---|
| US All OOH Q1 2026 | 7.1% |
| US Digital OOH Q1 2026 | 12.9% |
| UK All OOH Q2 2026 | 12.7% |
| UK Digital OOH Q2 2026 | 14.6% |
| UK Classic OOH Q2 2026 | 8.8% |
The UK pattern matches the US one: both channels grew, and digital grew faster. The UK total grew faster than the US total, but the two figures cover different quarters and come from different trade bodies with their own reporting panels. Any comparison between them is indicative at best. A single strong quarter can also reflect when large campaigns happened to land, so one release is a weak basis for a trend line.
FINDING FIVE
Programmatic Buying Was About 7% Of Global Digital Out Of Home Spend In 2025
WOO's first global measure of programmatic digital out of home put revenue at approximately $1.4 billion in 2025, equivalent to 7% of total digital out of home expenditure.
Programmatic buying is the part of the market that relies most on audience data, because trades are often triggered by audience conditions rather than a fixed booking. At 7%, it is still a small part of the market, which leaves room for growth. Because this is WOO's first measurement, there is no earlier year to compare it with, and the figure carries the word "approximately" in WOO's own wording.
FINDING SIX
Measuring The Audience At The Screen Has No Single Agreed Benchmark
The 2021 paper "Benchmark for Anonymous Video Analytics" found that no commonly accepted standard existed for evaluating and comparing out of home audience measurement systems. Its authors compared eight open-source algorithms across four hardware platforms, plus two commercial systems. OAAA, meanwhile, names Geopath's Audience Measurement Ratings as a cornerstone of out of home metrics and describes them as a standardized measurement consistent with other media metrics.
These two sources address different layers of measurement. OAAA is describing the industry's established ratings currency. The paper deals with camera-based anonymous video analytics placed at an individual screen, where each vendor defines detection, impression and attention in its own way. A network can trade on a standardized rating and still have no common yardstick for the sensor data it adds on top. The paper dates from 2021, and this report has no later source showing whether a benchmark has since been agreed.
WHAT TO ASK
What To Ask Before Trusting An On-Screen Audience Figure
Three questions separate a measured audience figure from an estimate. Each one can be checked with a document or a site visit.
How Is An Impression Defined
Find out whether an impression means a person detected anywhere in view, a face turned toward the screen, or someone who stayed for a minimum time. Two systems can report very different numbers for the same screen because they use different definitions. Ask for the definition in writing. Our article on DOOH proof of play and campaign verification covers the separate question of whether the creative actually played.
Where Does The Sensor Stop Working
A camera can only count faces it can resolve. Resolution falls with distance, light and steep mounting angles, so the measured zone in front of a screen has a hard edge. Ask where that edge is for each screen type. The physical limits are set out in our camera and site requirements standard.
What Is Measured And What Is Extrapolated
Many networks fit sensors to a sample of screens and project the results across the whole estate. That is a legitimate method if the sample covers each environment type, and the projection should be labelled as one. Ask which screens are measured directly and how the rest are estimated.
LIMITS
What The Data Does Not Show
None of the six sources measures audience size, attention or campaign outcomes. The spend figures show that advertisers are moving money onto screens. They do not show whether those screens deliver more attention than static formats, and they do not explain why the money moved. The national figures cover single quarters, and the global 2026 figures are forecasts. Neither the trade bodies nor WOO, in the pages read for this report, say how much of digital spend is currently traded on sensor-measured audience data versus location ratings. The benchmark paper is five years old. The figures are consistent with growing demand for screen-level measurement, but they do not prove it.
IN PRACTICE
How ARSA Approaches Screen-Level Measurement
ARSA's DOOH Audience Meter counts opportunities to see, measures attention duration and estimates age band and gender. It processes video on the device behind the screen or on the operator's own servers, stores no images and creates no identity. Attention means sustained frontal face orientation toward the display for longer than a configured threshold, typically 1.0 to 1.5 seconds. Briefer glances are logged as impressions.
| Requirement | Published Value |
|---|---|
| Pixel density at far edge of zone | 400 PPM |
| Viewing distance, 2 MP camera, 60 degree lens | Up to 4.2 m |
| Viewing distance, 8 MP camera | Up to 8.3 m |
| Minimum light at the face plane | 30 lux |
| Camera angle below horizontal | 0 to 15 degrees optimal, 25 maximum |
| Typical instrumented sample | 10% to 15% of screens |
The software edition maps measurement to playout schedules, so impressions are attributed to the right creative. Signage and notification duties under laws such as UK GDPR or Singapore's PDPA stay with the operator. A Remote Camera Design Review checks camera positions within one week. ARSA delivers outside Indonesia, and where visa conditions prevent its engineers from travelling, a qualified local partner installs under ARSA supervision.
FAQ
Frequently Asked Questions
What Is DOOH?
DOOH, or digital out of home, is advertising shown on digital screens in public places, such as roadside billboards, transit screens and retail displays. Unlike printed posters, the content can change by time of day, and inventory can be sold by slot, which is why audience data has become central to how it is bought.
How Fast Is Digital Out Of Home Advertising Growing?
Digital is growing faster than out of home as a whole in the markets with recent public figures. OAAA reports US digital revenue up 12.9% in the first quarter of 2026, and Outsmart reports UK digital up 14.6% in the second quarter. WOO forecasts global digital spend of $28 billion in 2026.
What Is An Impression In Digital Out Of Home Advertising?
An impression is a logged opportunity for a person to see an advert, and each measurement system defines exactly what triggers one. Some count any person detected in view. Others require a face turned toward the screen, which is why figures from two systems are hard to compare without their definitions.
What Is Audience Measurement In Out Of Home?
Audience measurement estimates how many people had the chance to see an out of home advert, and sometimes how long they looked. The industry's established ratings, such as Geopath's Audience Measurement Ratings named by OAAA, sit alongside camera-based systems at individual screens, which a 2021 benchmark paper found had no commonly accepted evaluation standard.
How Much Of DOOH Is Bought Programmatically?
About 7% globally, according to WOO's first global study, which put programmatic digital out of home revenue at approximately $1.4 billion in 2025. With no earlier year to compare against, the growth rate of programmatic buying is not yet measured.
For a look at how audience counting works at an individual screen, see ARSA's DOOH audience measurement system, and get in touch if you want your screen positions checked.