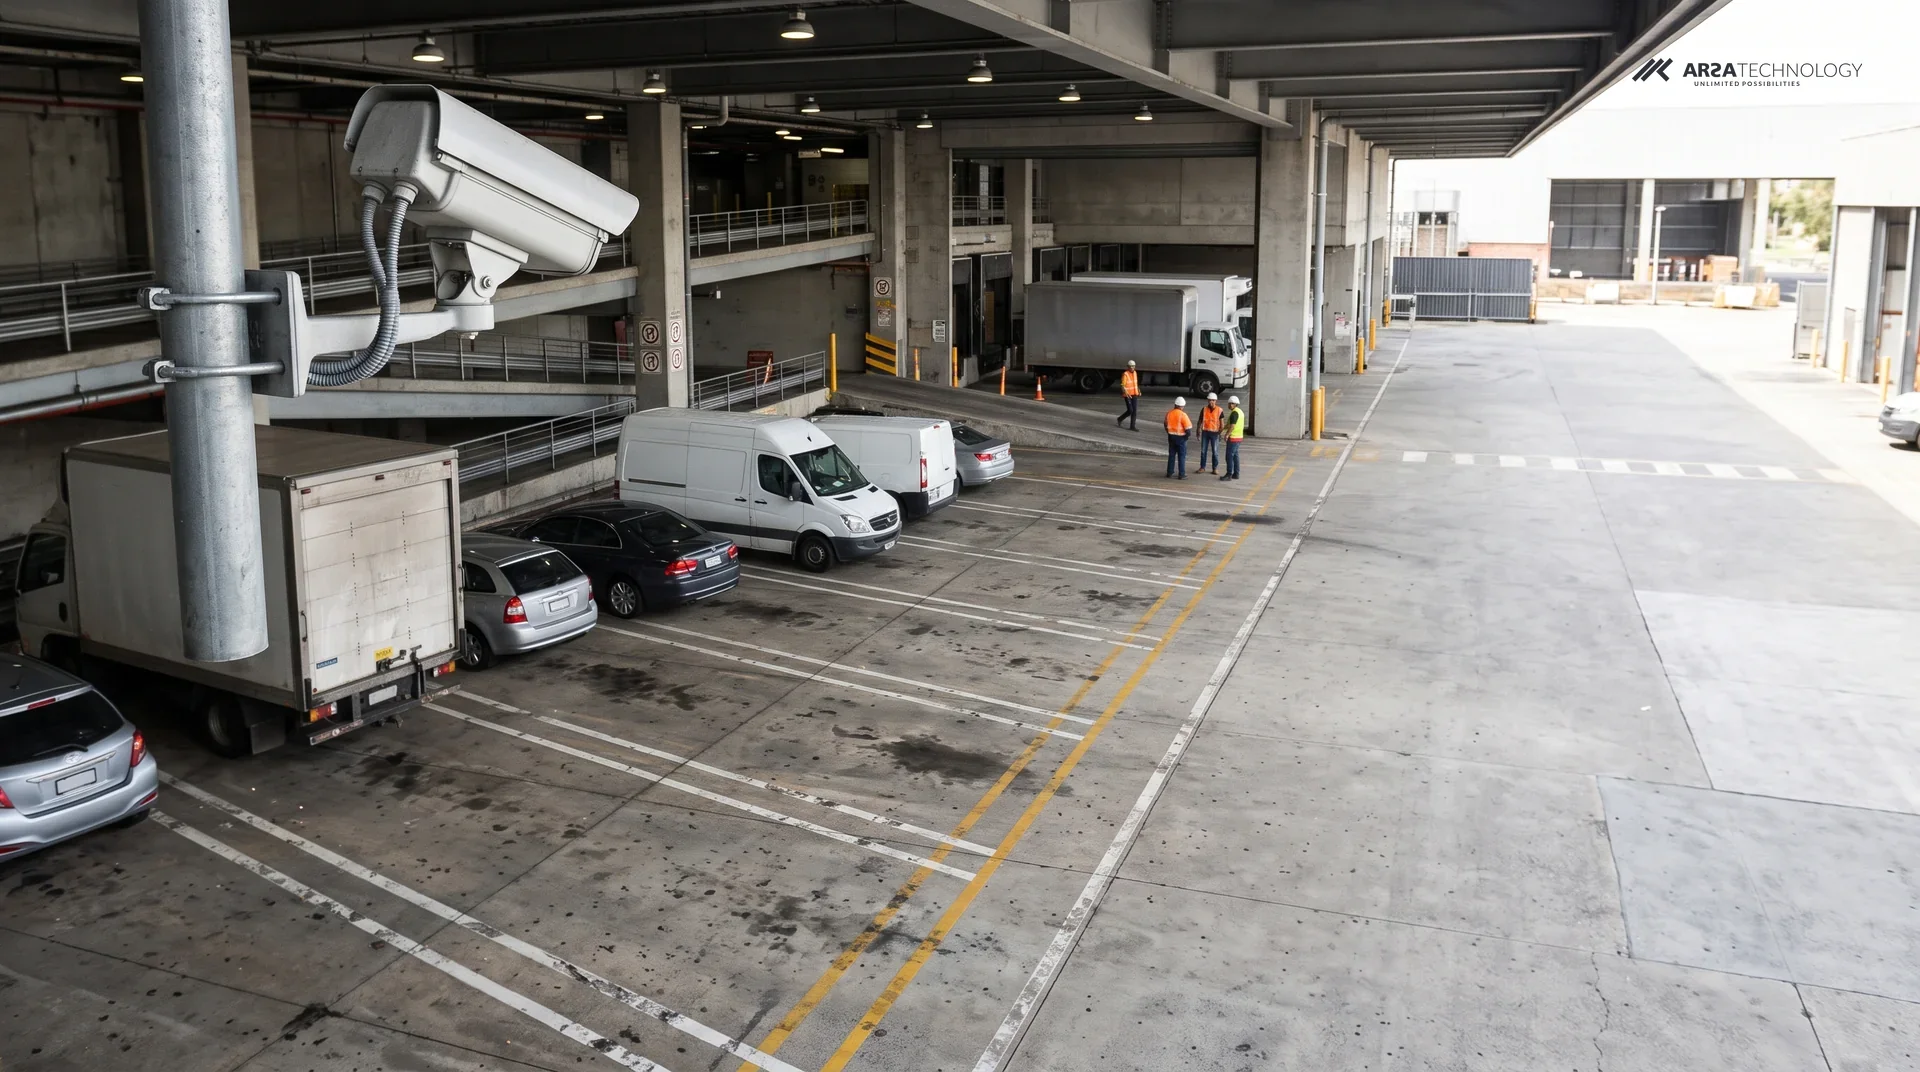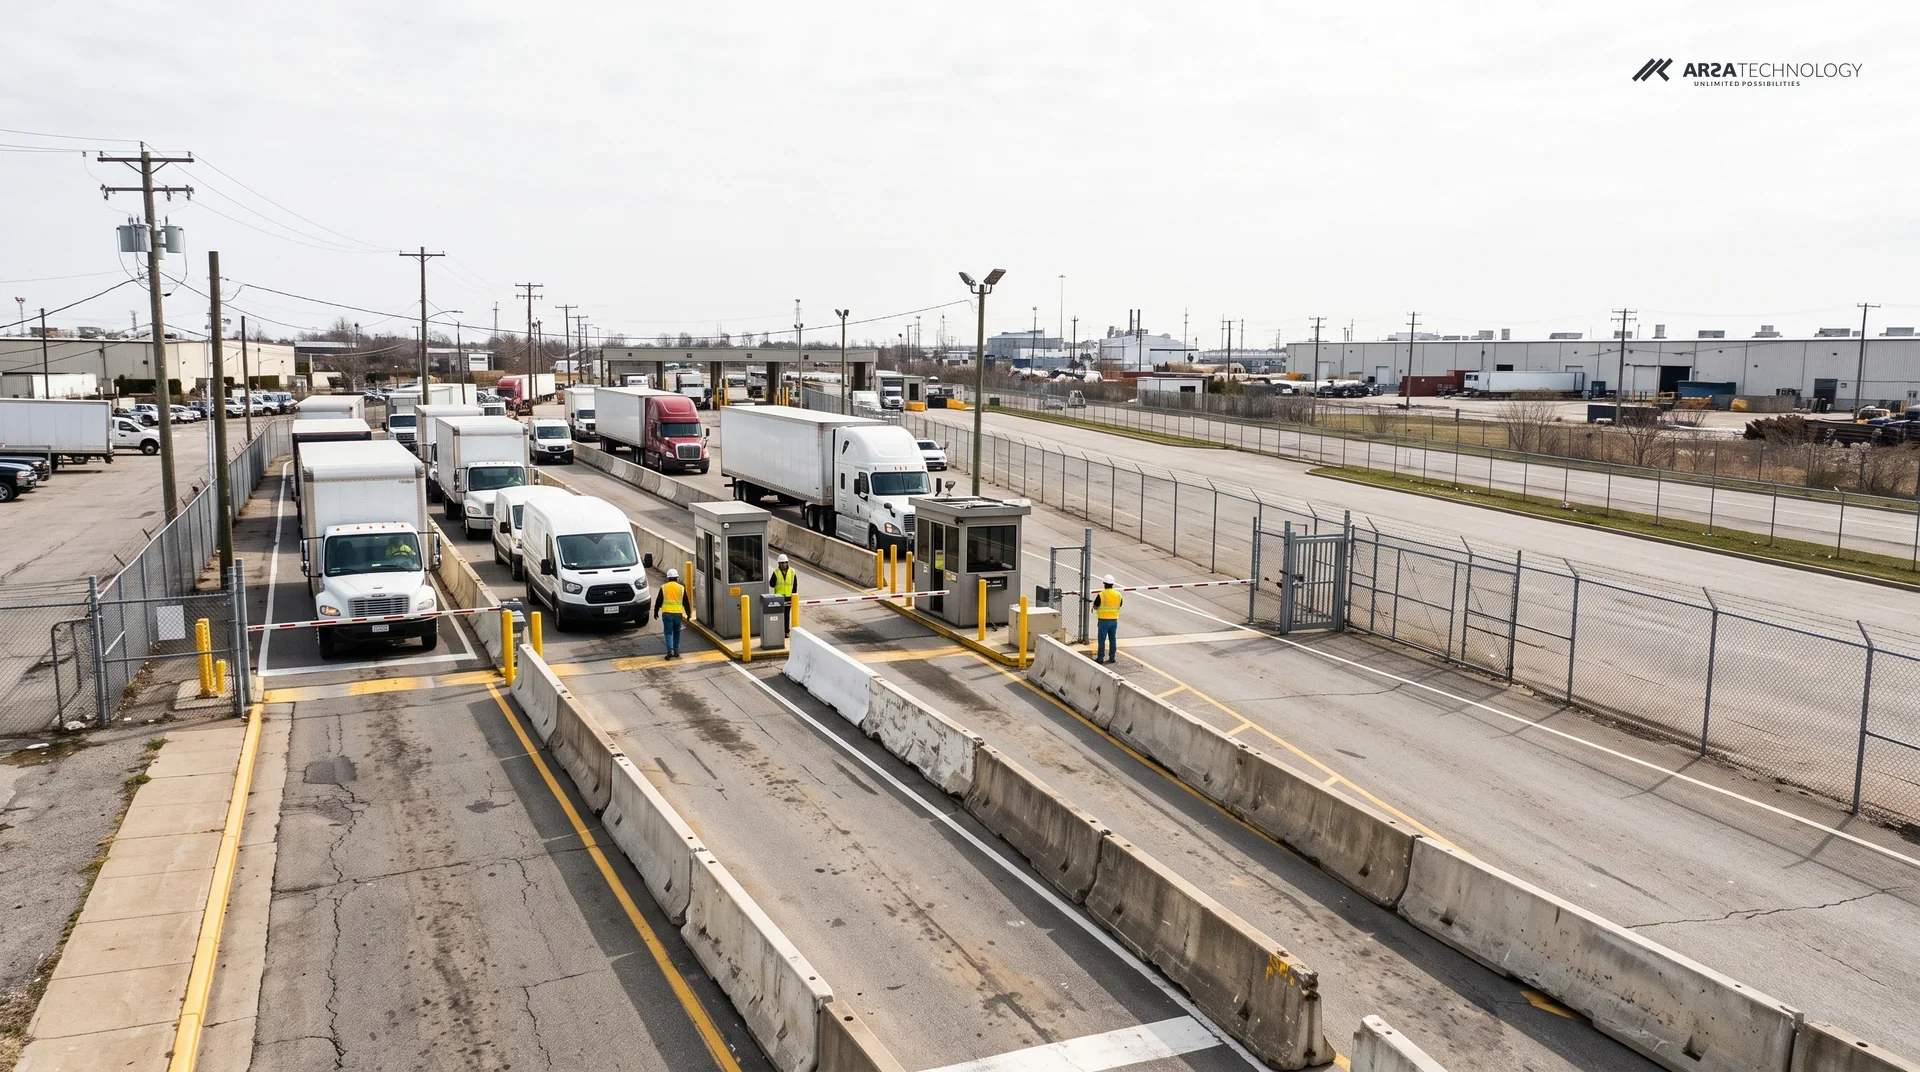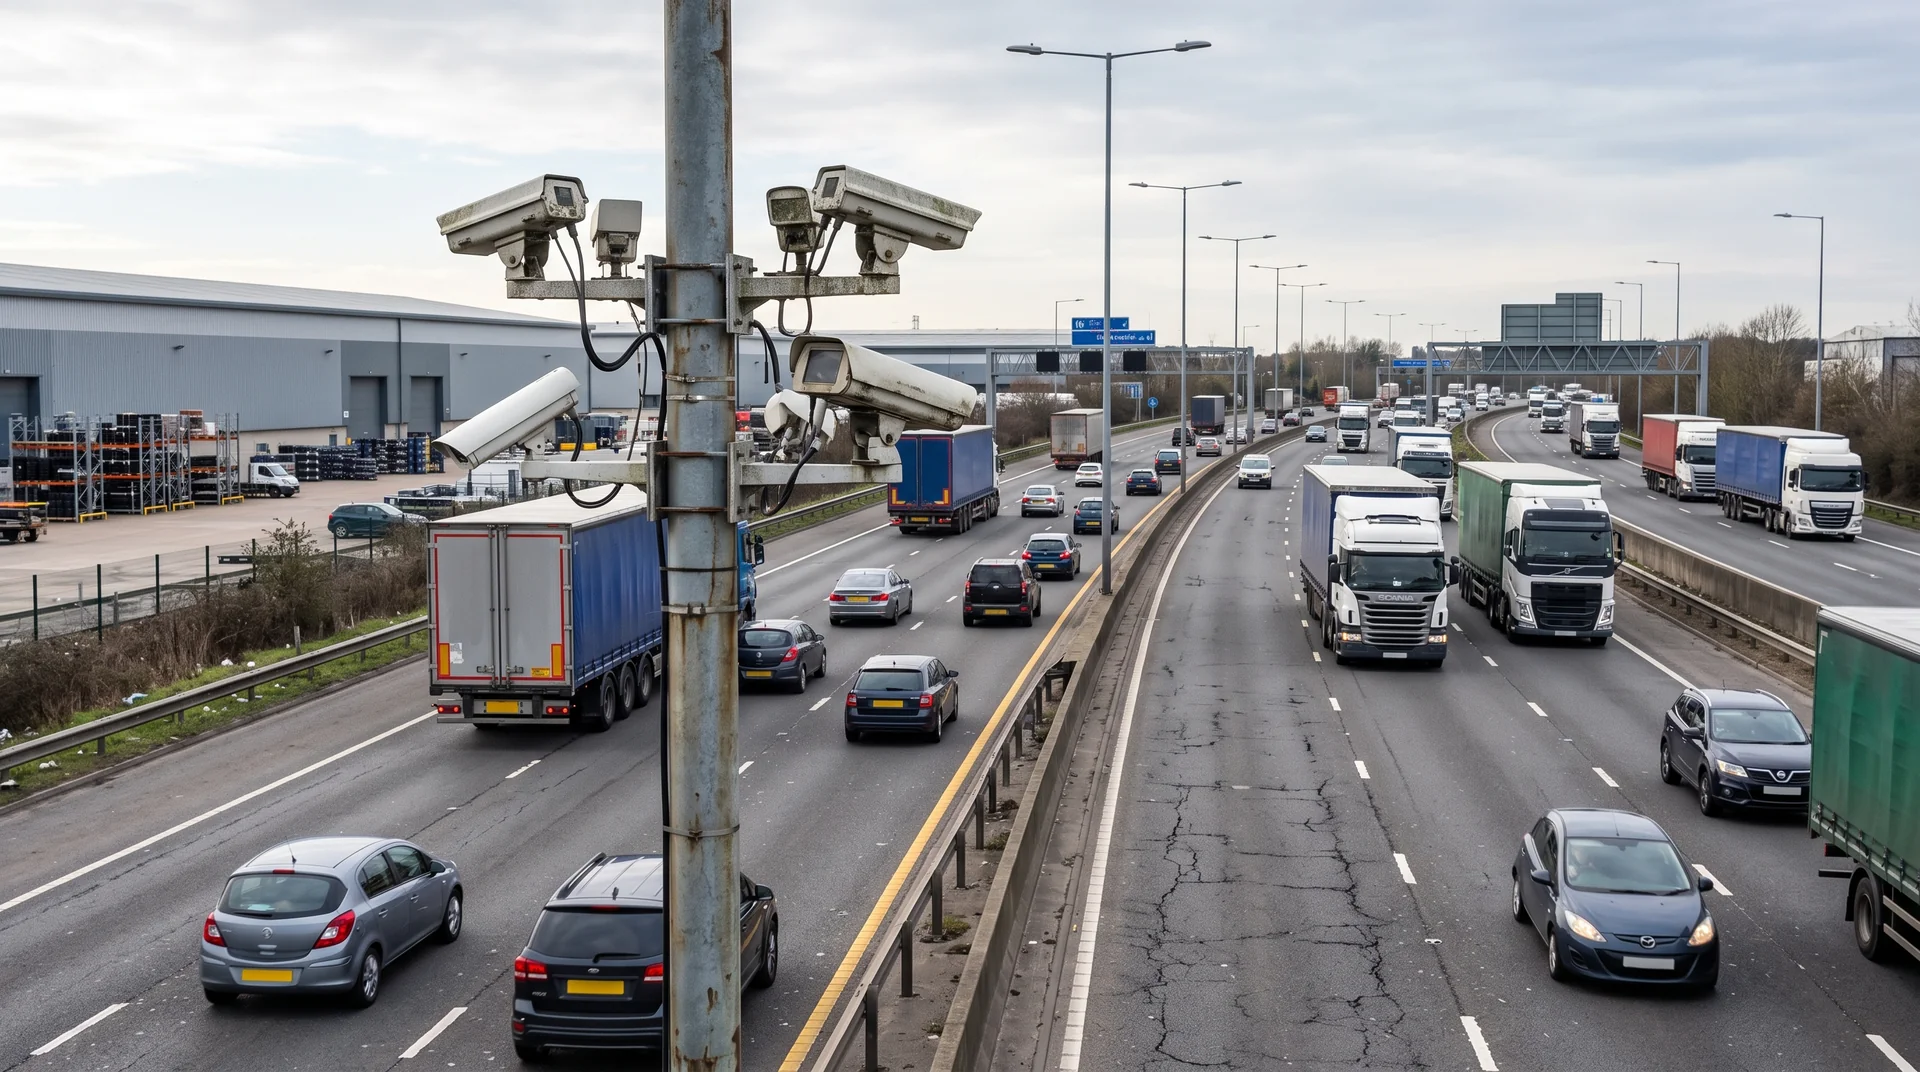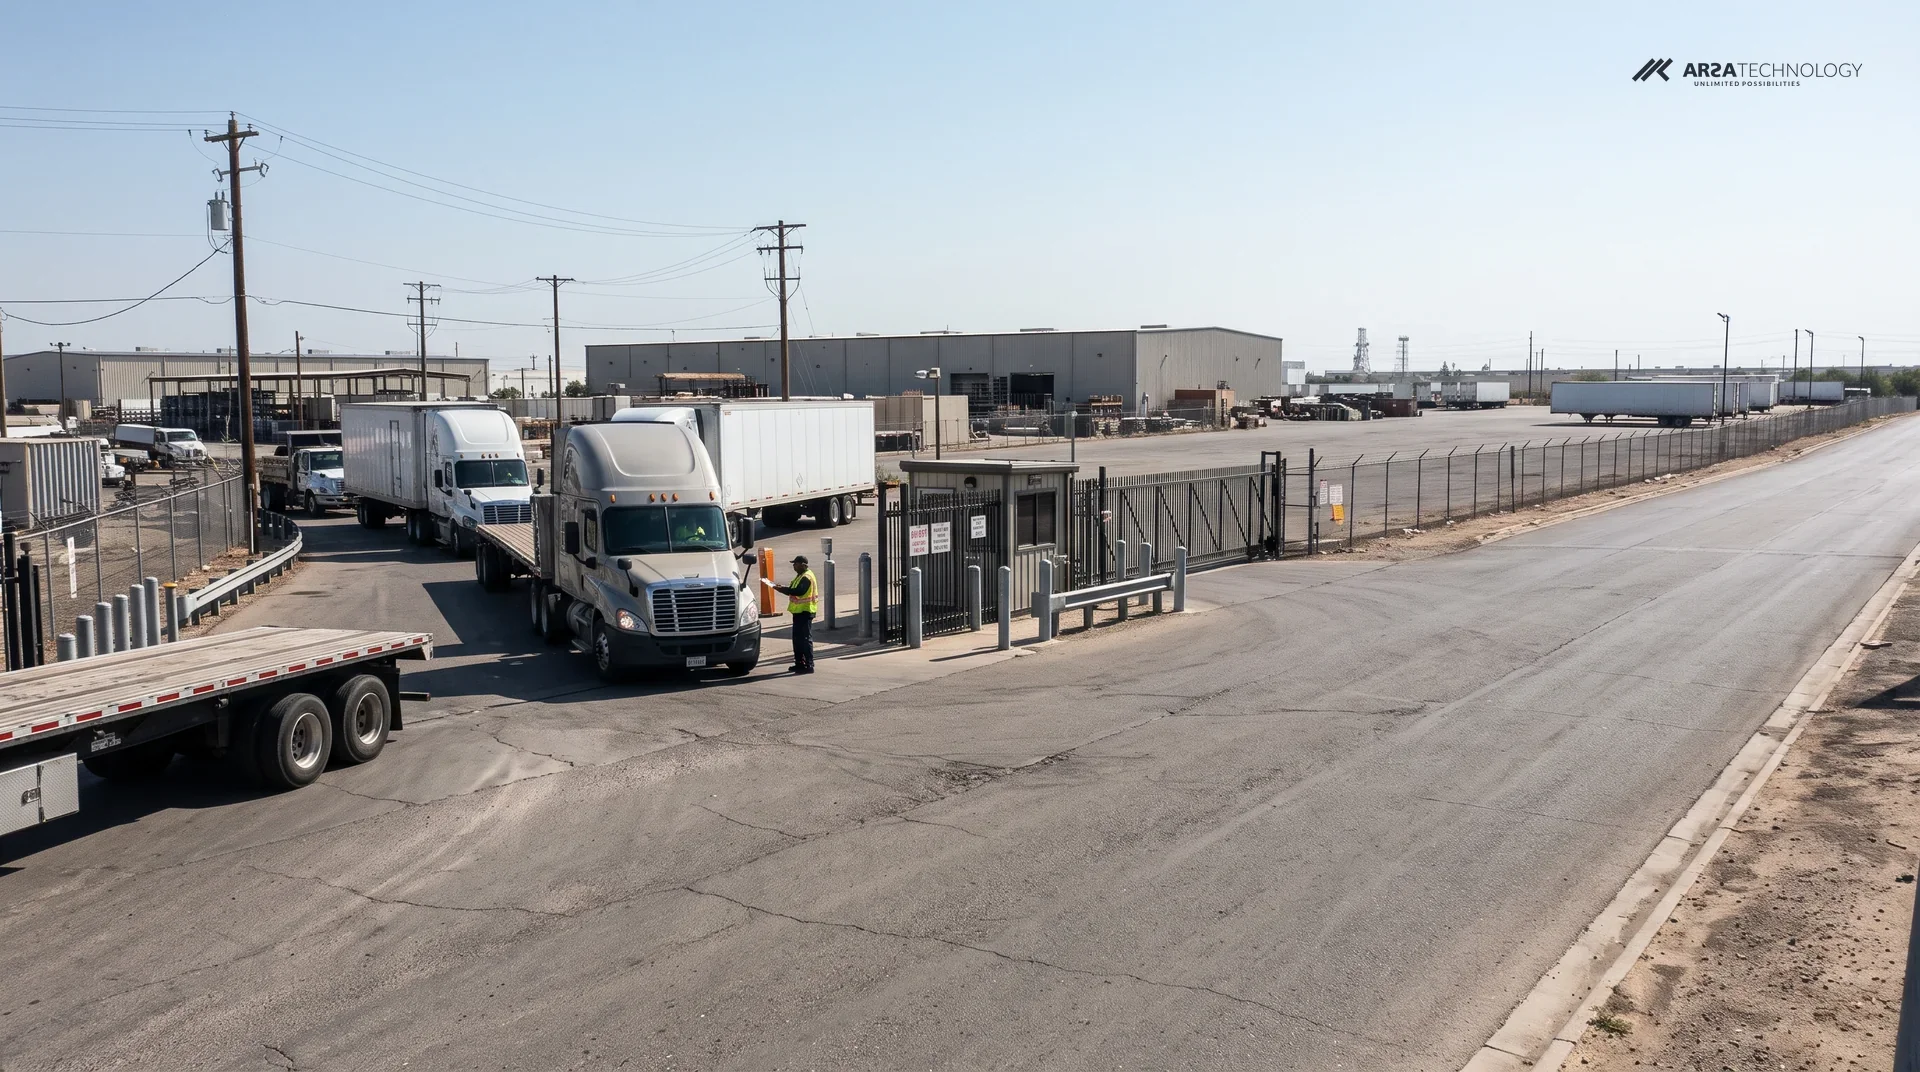

An illustrative scenario. The site and people are composites.
A logistics campus near a Gulf port wants to lease more warehouse space, and every new tenant brings more trucks onto the same access road. Before the expansion is signed, the operations team needs to know how many vehicles use that road each hour, what kind they are, and how close the gate approach already is to backing up. This scenario shows how classified counts from cameras on the campus could answer that, and which parts of the decision still belong to a traffic engineer.
THE SITE
A Single Access Road Feeding A Growing Campus
The site is a multi-tenant logistics campus a short drive from a container port in Dubai. It is reached from the main road by one access road with 2 lanes in each direction. Container chassis, curtain-siders, vans and staff cars use it at all hours. The gate system logs each transaction at the barrier but records nothing about the queue behind the barrier or the road itself.
The pressure on roads like this is public. The UAE Government Media Office reports more than 500,000 truck trips a day on Dubai's roads, with internal movement making up about 83% of truck traffic. Gulf News counts 85,000 trucks registered in Dubai. It also reports that registered vehicles in the commercial transport sector passed 500,000 in 2025, up 25% on the year before, and that licensed commercial transport companies rose from 12,100 to 16,917 (Gulf News). Demand for space is rising too. Knight Frank recorded 12.3 million square feet of new industrial and logistics requirements in Dubai in H1 2026, up from 11.5 million a year earlier, and rents in Dubai Industrial City rose 16%.
The operations manager puts the question plainly: if the planned warehouse block goes ahead, will the road cope with the morning peak, or will trucks back up onto the main road? From gate records, the site estimates today's traffic at 900 to 1,300 trucks a day. No one trusts that figure at the level of a single hour.
Congestion has a cost the industry has measured. In the United States, the American Transportation Research Institute put the cost of highway congestion to trucking at $108.8 billion in 2022. That is about $7,588 for every registered combination truck, across 1.2 billion hours of delay (FreightWaves). The Gulf has no matching published figure, but the mechanism is the same: a truck in a queue is a driver and a tractor earning nothing.
CONSTRAINTS
What The Campus Cannot Change
The campus cannot close the road to install counting equipment, cannot send video off site, and has to work mainly with cameras it already owns. The authorities are studying the same question at city scale: Dubai's RTA is building a predictive planning model of truck movement from field surveys, interviews and workshops (UAE Government Media Office). The campus wants its own numbers in a form its traffic consultant can use.
The Cameras
The road already has 2 MP security cameras on lighting poles. Many are tilted steeply down at the verge to catch intruders, a steep downward view that is poor for telling one vehicle type from another. Each camera has to be checked before it is used.
The Data
The campus legal team reads the UAE's Personal Data Protection Law as covering footage in which a person or a plate can be identified. Video therefore stays on the campus network, and plate reading is left out of scope.
The Climate
Summer heat and dust are hard on poles, cabinets and lenses. Every outdoor camera and cabinet has to be rated for that, and the server needs a cooled room. A site office is not suitable.
THE DESIGN
Classified Counts From Road Cameras On The Campus's Own Server
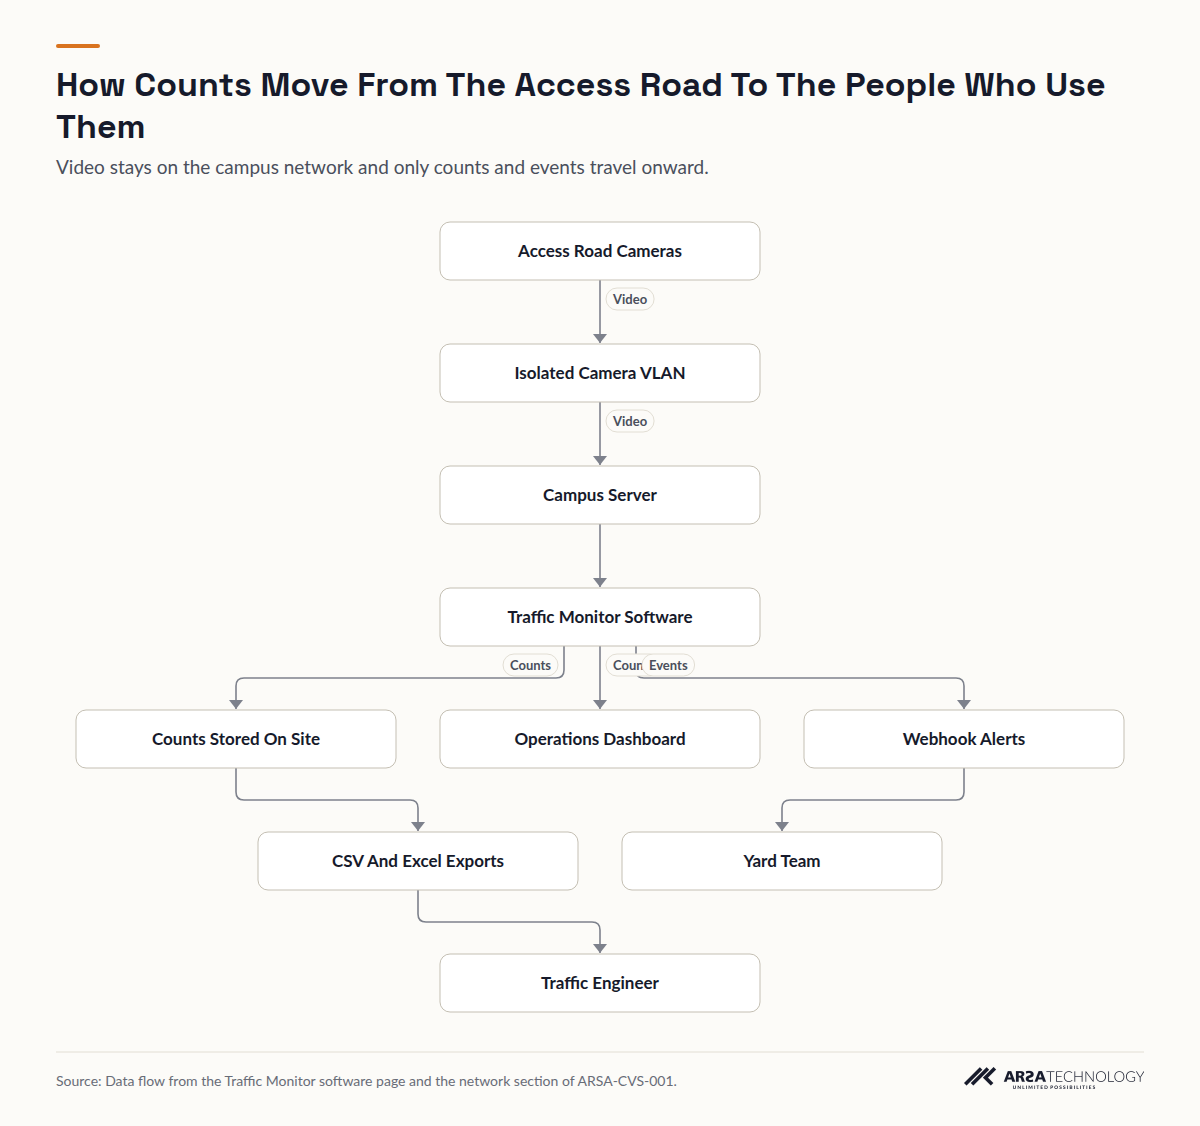
The design runs Traffic Monitor as software on a server the campus owns. It counts vehicles per lane and direction, classes them as cars, motorcycles, buses or trucks, measures traffic density, and detects congestion and its trend. Results appear on a dashboard, export as CSV, Excel or PDF, and reach other systems through a REST API, webhook push or the historical query API. Role-based access and audit logging control who sees what. Only the counts and events leave the server, and the video stays on the campus network.
There are 3 count points: where the access road leaves the main road, its midpoint, and the gate approach. Each point has one camera per carriageway (2 carriageways), and 0 to 2 extra cameras watch the queue at the gate. That comes to 6.0 to 8.0 cameras.
The placement figures come from ARSA's camera standard, ARSA-CVS-001, for a standard 60 degree lens:
| Requirement | Vehicle Classification | Vehicle Counting Only |
|---|---|---|
| Pixel density at the vehicle | 107 PPM | 67 PPM |
| Reach on a 2 MP camera | 15.6 m | 24.9 m |
| Reach on a 4 MP camera | 20.8 m | 33.3 m |
| Tilt below horizontal | 10 to 25 degrees optimal, 40 at most | 15 to 35 degrees optimal, 45 at most |
| Light at the target | 20 lux | 10 lux |
At the 15.6 m classification limit, a 2 MP camera covers a strip about 11 m wide. The product page puts that at roughly 3 lanes, which is enough for one carriageway and its shoulder. The standard sets 2 MP as the minimum and recommends 4 MP, at 15 fps minimum and 25 fps recommended, with a WDR of 120 dB where headlights face the lens. Outdoor units need IP66, and IP66 with IK08 is recommended for cabinets. For a Gulf summer, the design specifies the standard's recommended operating range of -20 to +60 °C instead of the minimum. On the analytic stream, smart codecs are turned off, bit rate is held constant, the minimum shutter is set by hand so trucks do not smear, privacy masks are turned off, and clocks are kept by NTP to within one second.
The software page sizes the server at 2 to 3 streams per 6 GB GPU, so this design needs 2.0 to 4.0 of them. Count data takes about 100 MB per camera per day. Kept for 1 to 3 years, that comes to 219 to 876 GB. The cameras sit on an isolated VLAN with no internet route, and the server pulls each stream from the camera directly. ARSA-CVS-001 also sets the access switch uplink below 70 percent at peak, latency under 20 ms, packet loss under 0.1 percent, and a UPS with at least 15 minutes of hold-up in a room under 35 °C.
Read As Text
- Access Road Cameras leads to Isolated Camera VLAN (Video)
- Isolated Camera VLAN leads to Campus Server (Video)
- Campus Server leads to Traffic Monitor Software
- Traffic Monitor Software leads to Counts Stored On Site (Counts)
- Traffic Monitor Software leads to Operations Dashboard (Counts)
- Traffic Monitor Software leads to Webhook Alerts (Events)
- Webhook Alerts leads to Yard Team
- Counts Stored On Site leads to CSV And Excel Exports
- CSV And Excel Exports leads to Traffic Engineer
THE ROLLOUT
From Camera Review To Weekly Counts
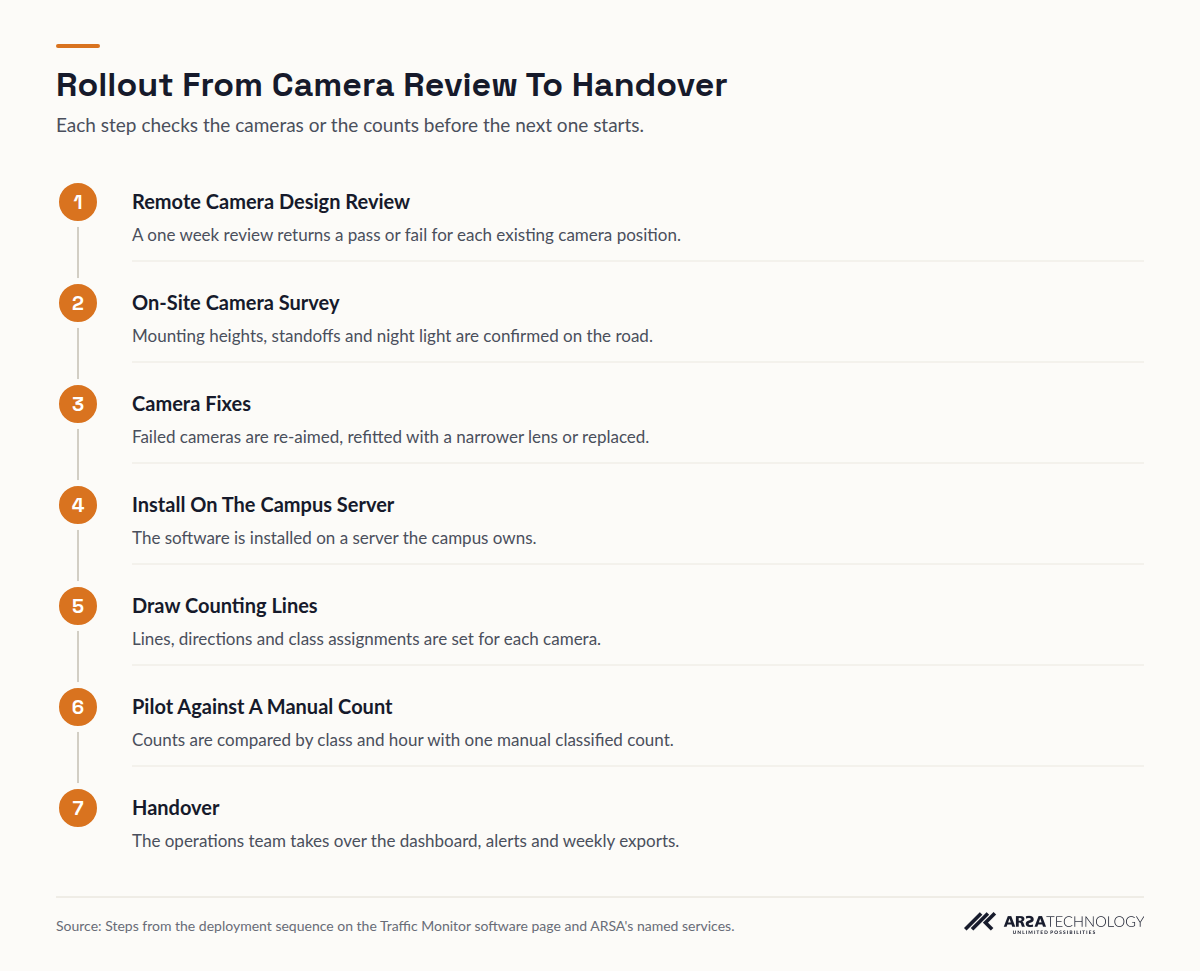
The rollout moves from checking the cameras on paper to running the system in daily use, and a manual count tests the system before anyone relies on it. It starts with a Remote Camera Design Review, which takes one week and returns a pass or fail for each existing camera position. An On-Site Camera Survey follows, covering up to 50 cameras, far more than this road needs, and it confirms the mounting heights, standoffs and light at night.
Cameras that fail are re-aimed, refitted with a narrower lens or replaced. The software is then installed on the campus server, and counting lines, directions and class assignments are drawn for each camera in the web interface. A pilot runs alongside one manual classified count so the two can be compared by class and by hour, and the system is handed over after that. ARSA delivers outside Indonesia, and where visa conditions prevent its engineers from travelling, a qualified local partner installs under ARSA supervision.
Read As Text
- Remote Camera Design Review A one week review returns a pass or fail for each existing camera position.
- On-Site Camera Survey Mounting heights, standoffs and night light are confirmed on the road.
- Camera Fixes Failed cameras are re-aimed, refitted with a narrower lens or replaced.
- Install On The Campus Server The software is installed on a server the campus owns.
- Draw Counting Lines Lines, directions and class assignments are set for each camera.
- Pilot Against A Manual Count Counts are compared by class and hour with one manual classified count.
- Handover The operations team takes over the dashboard, alerts and weekly exports.
A DAY IN OPERATION
An Ordinary Weekday On The Access Road
On an ordinary day the counts build up without anyone watching, and people look at them only when a pattern or an alert calls for it. Before the morning shift change, the logistics coordinator checks the dashboard. Inbound truck density at the gate approach is rising earlier than it did last week. When the software flags congestion there, a webhook posts the event to the yard team, and the gate supervisor opens a second inbound lane at the barrier.
Each week the facilities manager exports the classified counts as CSV and sends them to the traffic consultant. The consultant sees trucks, buses, cars and motorcycles per lane, direction and hour, including the overnight hours a manual count never covers. Over a season, those exports become the baseline the consultant's capacity analysis is built on.
WHAT IT COULD CHANGE
What The Numbers Could Show
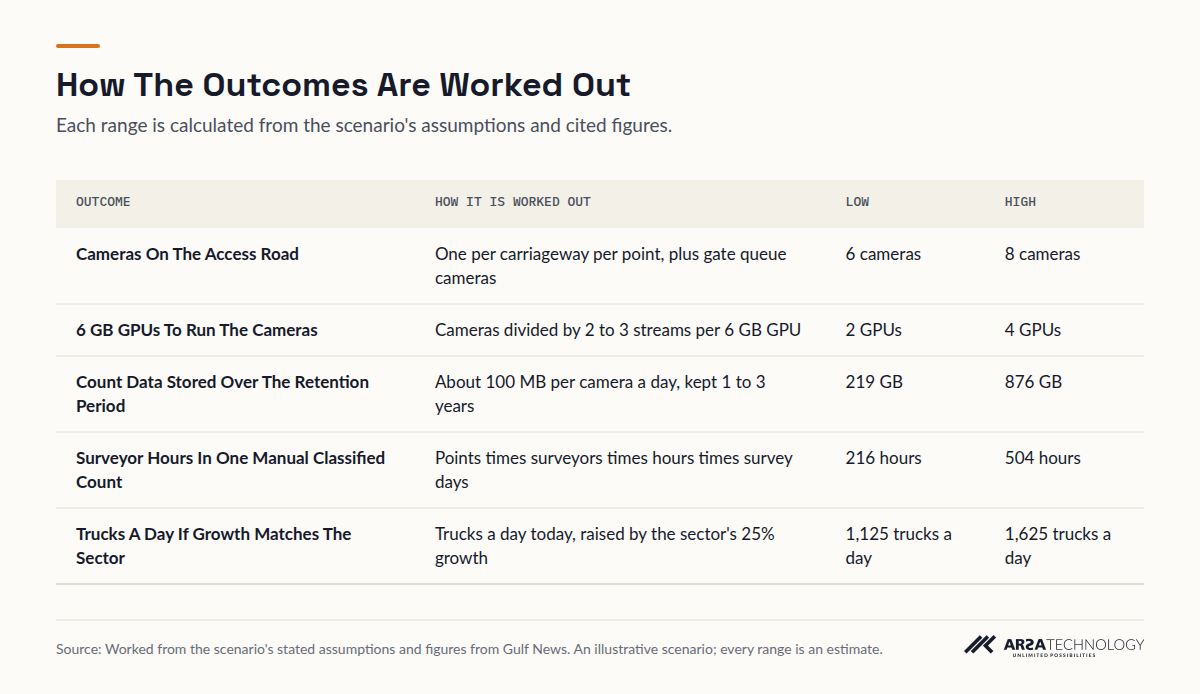
The main change is that the campus's road decision would rest on continuous classified counts in place of one survey. A single manual classified count, with 2 surveyors at each of the 3 points working 12 hours a day for 3 to 7 days, takes 216 to 504 surveyor hours and still misses every night. The cameras count every hour of every day after handover.
The counts also make it possible to stress-test the expansion. If today's 900 to 1,300 trucks a day grew at the sector's published 25% rate, the road would carry 1,125 to 1,625 trucks a day before any new tenant arrives. That is a stress test drawn from a city-wide figure. It is not a forecast for this road. The hardware side stays modest: 6.0 to 8.0 cameras, 2.0 to 4.0 GPUs, and 219 to 876 GB of stored counts.
View The Data
| Outcome | How It Is Worked Out | Low | High |
|---|---|---|---|
| Cameras On The Access Road | One per carriageway per point, plus gate queue cameras | 6 cameras | 8 cameras |
| 6 GB GPUs To Run The Cameras | Cameras divided by 2 to 3 streams per 6 GB GPU | 2 GPUs | 4 GPUs |
| Count Data Stored Over The Retention Period | About 100 MB per camera a day, kept 1 to 3 years | 219 GB | 876 GB |
| Surveyor Hours In One Manual Classified Count | Points times surveyors times hours times survey days | 216 hours | 504 hours |
| Trucks A Day If Growth Matches The Sector | Trucks a day today, raised by the sector's 25% growth | 1,125 trucks a day | 1,625 trucks a day |
THE LIMITS
What The System Does Not Decide
The system produces counts, classes, density and congestion trends. It does not calculate road capacity or level of service, and it does not approve an expansion. A traffic engineer turns the counts into a capacity analysis, and any study a planning authority asks for is still the engineer's to prepare.
The software page lists four classes. If the consultant needs articulated trucks counted separately from rigid ones, ask ARSA before relying on that split. ARSA's published vehicle detection figure is 0.887 AP50 (0.799 at IoU 0.7) on UA-DETRAC traffic-camera footage, with AR-GenModel-v17, tested on 11 November 2026. There is no published figure for vehicle classification, so the pilot comparison with a manual count is how this road's accuracy gets measured. Extreme low light or heavy rain degrades classification before it degrades basic counting. Plate reading would need 325 PPM, reached only within 5.1 m on a 2 MP camera, and it is left out here.
Several assumptions would move the ranges. The queue camera range depends on how far back the gate queue reaches. The surveyor hours depend on how long a consultant's manual count runs. The storage depends on the retention the campus chooses, and the truck range depends on the gate-record estimate and the growth assumption. In the first months, the site would measure peak-hour trucks by class and direction, overnight volumes, and how often congestion is flagged at the gate approach. That shows where in each range the road actually sits.
THE CHECKLIST
The Design Checklist
This checklist collects every site requirement the scenario relied on, so a campus team can tick off its own road before a review. The figures come from ARSA-CVS-001 and the product page; traffic analytics on existing CCTV cameras covers reusing cameras in more depth, and warehouse and logistics video analytics covers the yard and dock side.
FAQ
Access Road Traffic Counting Questions
Can A Camera Tell Trucks From Cars On A Logistics Access Road?
Yes, when the camera delivers 107 pixels per metre at the vehicle. In practice that means within 15.6 m on a 2 MP camera or 20.8 m on a 4 MP camera with a 60 degree lens. The software classes cars, motorcycles, buses and trucks per lane and direction. Finer truck categories should be confirmed with the vendor before the study depends on them.
How Far From The Road Can A Vehicle Classification Camera Sit?
Up to 15.6 m on a 2 MP camera and 20.8 m on a 4 MP camera with a standard 60 degree lens, tilted 10 to 25 degrees below horizontal. Counting alone reaches further, to 24.9 m and 33.3 m, because it needs only 67 pixels per metre.
Can Classified Counts Replace A Traffic Impact Study?
No. They supply the study's inputs: continuous counts by class, lane, direction and hour. The capacity analysis and any submission to a planning authority remain the traffic engineer's work. Better inputs make that analysis less dependent on a single survey week.
Do Existing Security Cameras Work For Vehicle Counting?
Some do. A camera works when it meets the pixel density, tilt and light the task needs, and many security cameras are tilted too steeply or mounted too far from the lanes. A camera design review gives each position a pass or fail before anything is installed.
Does The Video Leave The Campus?
No. The software runs on a server the campus owns, the cameras sit on an isolated VLAN, and only counts and events go to the dashboard, the exports and the webhook.
How Long Before The Counts Can Be Trusted?
Once the pilot's counts match a manual classified count closely enough for the consultant's purpose. That comparison, made by class and by hour, is the site's own accuracy check, since no published classification figure exists.
For a closer look at running these analytics on servers a site already owns, see the vehicle counting software. If you would like to see it on your own road, send a few clips from your cameras for a free AI assessment by an ARSA engineer.