
The Complete Guide To AI Vehicle Counting And Classification
AI vehicle counting and classification uses video analytics on road cameras to count every vehicle by lane and direction and sort it into types such as car, truck, bus, motorcycle and bicycle, around the clock. The decision usually sits with three people: a traffic or operations manager who needs the numbers, an IT lead who has to host the system, and a buyer who has to compare it with loops, tubes and radar. This guide covers how the technology works, what a camera position needs before it can count or classify, how to run it, how to judge a vendor, how a rollout runs and where projects go wrong. Each part links to a longer article on that subject.
CONTENTS
Contents
- What AI Vehicle Counting And Classification Is
- How Video Counting Works From Frame To Count
- How Video Compares With Loops, Tubes And Radar
- What The Camera And Site Need
- Running It At The Roadside Or On A Central Server
- Where The Counts Earn Their Keep
- Plate Reading, Privacy And The Law
- How To Evaluate A Vendor
- How A Rollout Runs And What Goes Wrong
- How ARSA Approaches Vehicle Counting
- Frequently Asked Questions
THE BASICS
What AI Vehicle Counting And Classification Is
AI vehicle counting is software that finds each vehicle in a camera's picture, follows it across the frame and adds it to a count when it crosses a line you have drawn. Classification is the second step: the same software decides what kind of vehicle it is and records the count by class, lane, direction and time.
The output is a time series, for example southbound lane 2 carrying 142 cars, 18 trucks and 3 buses between 07:00 and 07:15. That is the same kind of table a manual enumerator or an automatic traffic counter produces. The difference is that a camera already on a pole can produce it every day of the year. Most counting programmes still use short samples for this. Britain's Department for Transport, for example, builds its national road traffic estimates from about 8,000 manual counts a year, each covering 12 hours on one weekday from 7am to 7pm, plus a permanent network of around 300 automatic counters (DfT road traffic statistics). Continuous counts from video do not replace a national statistical method. They do fill the gaps between sampled days at the sites that matter to you.
It helps to keep three outputs apart, because each one asks more of the camera than the one before:
- Counting asks whether a vehicle crossed the line, in which lane and in which direction.
- Classification asks what kind of vehicle it was.
- Plate reading asks which vehicle it was, and it raises privacy and legal questions that the first two do not.
THE MECHANICS
How Video Counting Works From Frame To Count
Every frame goes through four steps: a detector draws a box around each vehicle, a tracker links the boxes from frame to frame into one path per vehicle, the geometry you configured turns each path into an event, and the events are added up into counts. Errors at any of the four steps end up in the final number, so a good system lets you see each step on its own.
Detection. A model trained with standard deep learning frameworks finds vehicles in each frame and gives each one a class. How well it does depends far more on how many pixels the vehicle covers than on how clever the model is, which is why the camera section below matters most.
Tracking. A vehicle is counted once only if the tracker keeps its identity as it moves. Occlusion breaks tracks: a truck hiding a car in the next lane, or a bus stopping in front of the camera. When a track breaks and starts again, the system can count one vehicle twice. That is why a good layout puts the counting line where vehicles are seen clearly and apart from each other.
Geometry. You draw counting lines, lane zones and direction arrows on the camera view. Many systems also let you draw a pair of speed lines a known distance apart, which gives an estimated speed, and zones where stopping is not allowed. Setting this up well is a skill of its own, and it is where most avoidable errors start. Our step-by-step guide to setting up lane-by-lane vehicle counting zones covers where to place the lines, how to handle lane changes and how to check the result against a manual count.
Aggregation. Events are grouped into intervals, usually 5, 15 or 60 minutes, and sent to a dashboard, a file export or a traffic management system. For road agencies the common exchange format is DATEX II, the European standard for traffic data published as EN 16157.
What "Classification" Means In Practice
Video classifiers sort vehicles by how they look: car, truck, bus, motorcycle, bicycle. Road agencies in the United States usually report something else. The Federal Highway Administration's Traffic Monitoring Guide uses a 13-class scheme based mainly on axle count and axle spacing, and it notes that automated classifiers often find class 3 hard to tell apart from class 2, so the two are sometimes merged (FHWA Traffic Monitoring Guide). A camera that says "truck" has not said how many axles that truck has. If your counts feed an FHWA submission or a pavement design model, settle the mapping between classes before you buy. Our article on how AI traffic cameras support FHWA vehicle classification counts explains where video fits into that scheme and where an axle-based sensor is still needed.
THE ALTERNATIVES
How Video Compares With Loops, Tubes And Radar
Video counts lanes, directions and turning movements from one pole, often using a camera you already have, and it classifies vehicles by how they look. Its weak points are light, weather and distance. Loops and tubes classify by length or axles, are less affected by light, and need work on or across the road surface.
| Technology | What It Measures | How It Classifies | Installation | Main Limitation |
|---|---|---|---|---|
| Inductive loop | Presence and volume per lane | By length, with suitable detectors | Cut into the road surface, needs a lane closure | Damaged by resurfacing and roadworks |
| Pneumatic tube | Axle hits | By axle count and spacing, close to FHWA classes | Laid across the road, usually temporary | Short surveys, harder on wide multi-lane roads |
| Side-fire radar | Volume and speed per lane | By length bands | Pole mounted, no road works | Length bands only, no visual type |
| AI video | Volume per lane and direction, turning movements, speed estimate | By visual type: car, truck, bus, motorcycle, bicycle | Pole camera, often an existing one | Needs enough pixels, angle and light on the vehicle |
No technology wins on every row. Many agencies keep a few axle-based stations to anchor their classification figures and use video to cover the many approaches and junctions that sensors set into the road never reached. The same choice comes up across a large camera network, which our guide to AI vehicle counting for smart city traffic management covers at city scale.
THE CAMERA
What The Camera And Site Need
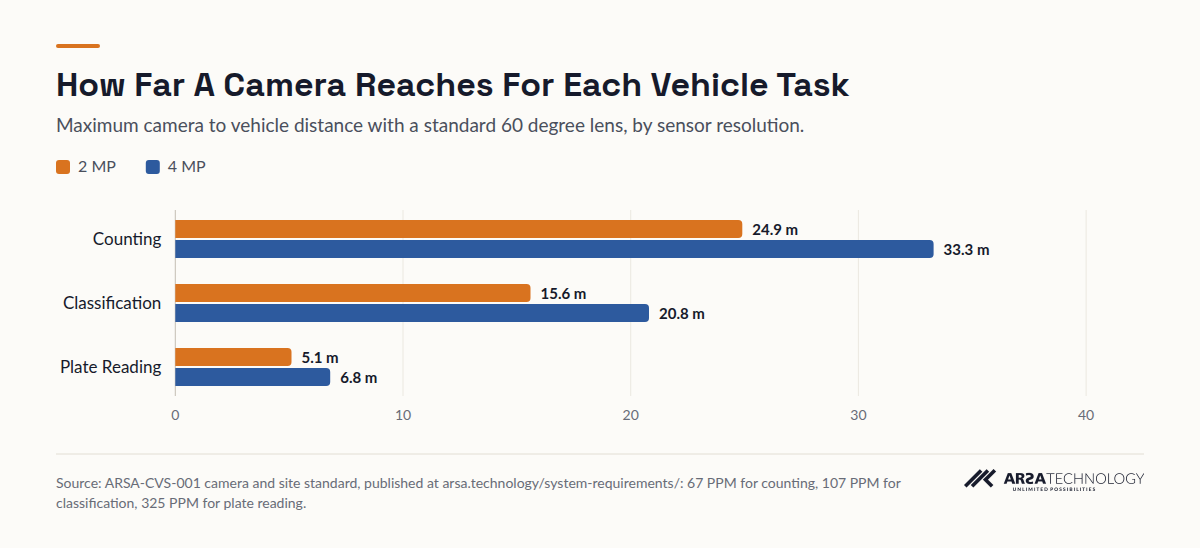
Whether a camera can count or classify comes down to one number: how many pixels it puts across one metre of road at the place where vehicles cross the line, written as PPM (pixels per metre). Counting needs about 67 PPM, classification about 107 and plate reading about 325. Pixel density falls as distance grows, so each task has a maximum reach for each camera.
Those thresholds come from the published ARSA-CVS-001 camera and site standard, and the reasoning applies to any vendor's analytics: software cannot recover detail the camera never captured. With a standard 60 degree lens, a 2 MP camera counts vehicles up to 24.9 m away and classifies them up to 15.6 m away. A 4 MP camera reaches 33.3 m and 20.8 m. Plate reading falls to 5.1 m on 2 MP and 6.8 m on 4 MP, which is why plate cameras are framed tightly on a single lane.
View The Data
| 2 MP | 4 MP | |
|---|---|---|
| Counting | 24.9 m | 33.3 m |
| Classification | 15.6 m | 20.8 m |
| Plate Reading | 5.1 m | 6.8 m |
| Task | Pixel Density At Vehicle | Reach, 2 MP | Reach, 4 MP | Optimal Tilt | Maximum Tilt | Minimum Light |
|---|---|---|---|---|---|---|
| Vehicle counting | 67 PPM | 24.9 m | 33.3 m | 15 to 35 degrees | 45 degrees | 10 lux |
| Vehicle classification | 107 PPM | 15.6 m | 20.8 m | 10 to 25 degrees | 40 degrees | 20 lux |
| Licence plate reading | 325 PPM | 5.1 m | 6.8 m | 10 to 25 degrees | 30 degrees | IR illumination |
Reach is measured with a standard 60 degree lens. A narrower lens roughly doubles each distance and halves the width of road covered.
Five more conditions decide whether a position works:
Resolution and frame rate. The floor is 2 MP at 15 fps. 4 MP is recommended. Each step up in resolution gives each pixel less light, so an 8 MP camera can perform worse at night than a 4 MP camera with a longer lens.
Angle. A camera looking steeply down sees roofs, which tell a van from a small truck poorly. A camera looking along the road sees vehicles hide one another. The tilt bands in the table are the range that avoids both problems.
Light and glare. Counting needs about 10 lux on the road and classification about 20. At night, headlight glare washes out the picture. A wide dynamic range of 120 dB or more is recommended.
Shutter and encoding. Automatic exposure lengthens the shutter in low light and smears moving vehicles, so set the minimum shutter by hand. Turn off smart codecs on the analytics stream, because they compress the background where distant vehicles appear.
Housing. Roadside cameras and cabinets need IP66 ingress protection, with IK08 impact resistance recommended for outdoor cabinets.
You can check a planned position before anyone climbs a pole with the lens and field of view visualiser, which shows how wide the covered road is and what pixel density reaches each distance for a given sensor and lens. One rule of thumb from the same geometry: at the 15.6 m classification limit, a 2 MP camera with a 60 degree lens covers a strip about 11 m wide, which is about three lanes. Wider roads need a second camera or a higher resolution sensor.
THE INFRASTRUCTURE
Running It At The Roadside Or On A Central Server
Analytics run in one of two places: on a small edge unit in the roadside cabinet next to the camera, or on a server in a control room that the camera streams already reach. Choose by backhaul. If video already reaches a central site, a server is simpler. If it does not, processing at the pole sends only the counts upstream.
A 2 MP camera at constant bitrate sends about 2.48 Mbps and fills about 26.7 GB of storage a day, according to the same camera standard. Sending that from a remote junction over cellular is expensive and unreliable. Sending 15-minute counts is trivial. That is the main argument for the edge: the cabinet does the work and the network carries numbers. The argument for a central server is fewer devices to maintain. You add cameras by adding capacity in one rack, and every approach goes into one dataset.
Whichever you pick, put four running questions in the specification:
- Offline behaviour. Does counting carry on when the uplink drops, and are counts held and sent later?
- Environment. Is the edge unit rated for the cabinet's temperature range, or does it need a cooled enclosure? Is the server room within its limits?
- Recording. Does the system keep video, for how long, and who can export it? Many systems record continuously by default, which affects your privacy assessment.
- Integration. Does the output arrive in the format your traffic or data platform already reads: DATEX II, a REST API, webhooks or scheduled CSV and Excel files?
Many sites already run IP cameras for security. Adding analytics to those streams is often the fastest start, provided each camera passes the pixel density and angle checks above. Our article on AI traffic analytics with existing CCTV cameras walks through that route.
THE USES
Where The Counts Earn Their Keep
The counts pay for themselves where a decision is waiting on them: a signal timing plan, a road capacity question, a gate staffing roster. The cost of congestion gives a sense of scale. INRIX's 2025 Global Traffic Scorecard puts the typical US driver's loss at 49 hours a year, worth $894 in lost time, and about $85.8 billion nationally (INRIX 2025 Global Traffic Scorecard). Our article on the business case for AI vehicle counting goes further into congestion cost data and how to frame a payback case.
Road Agencies And Councils
Continuous counts by class at junctions and corridors make signal retiming, before and after studies of road schemes, and peak hour reports possible without booking a survey crew. An 85th percentile speed estimate from speed line pairs helps decide where to enforce, but it is an advisory figure and cannot serve as evidence for a ticket.
Logistics Campuses, Ports And Industrial Sites
Truck counts by gate and by hour show when an access road nears capacity, when a gate needs another lane open, and how site traffic mixes with staff cars and buses. Our scenario on whether a Gulf logistics campus access road can take more truck traffic works through that question with classification counts and calculated ranges.
Car Parks, Campuses And Private Roads
Entry and exit counts by vehicle type support parking occupancy figures, shuttle bus planning and private road maintenance budgets. Here the camera usually already exists, the distances are short, and counting is often the easiest of the three tasks to get right.
THE LAW
Plate Reading, Privacy And The Law
Counting and classification on their own produce anonymous totals. Plate reading identifies vehicles, and through them people, so it brings in data protection law in every market this guide covers. Settle the legal basis, retention and access before you switch it on.
In the United Kingdom, the Information Commissioner's Office guidance on video surveillance covers automatic number plate recognition explicitly. It expects a data protection impact assessment covering the use of ANPR and its effect on people's rights, and it expects defined retention periods for the data captured (ICO video surveillance guidance). Singapore's PDPA, the UAE's PDPL and Australia's Privacy Act each ask for a defined purpose, notice and controlled retention in their own terms, so check with counsel in each jurisdiction.
Even for counting alone, the video the system records is personal data where drivers or pedestrians can be identified, so retention and export controls still count. In practice, keep plate reading to the lanes that need it, such as a gate or a watchlist check, and run counting and classification across everything else. Plate reading at gates has its own design rules, covered in our article on ANPR gate access control for logistics warehouses and ports, which deals with lane framing, watchlists and the gate workflow.
THE BUYING DECISION
How To Evaluate A Vendor
Judge a vendor on your own footage and on how openly they describe the limits of their system. A brochure figure tells you very little. Ask every shortlisted vendor to run the same clips from your cameras and to report counts by class against a manual count of the same minutes.
The questions that separate vendors:
Do they state camera requirements in numbers? A vendor who publishes pixel density, tilt and light thresholds per task can tell you before a contract which positions will fail. One who says "works with any camera" will find out during commissioning, at your expense.
Where do their accuracy figures come from? A published benchmark should name the dataset and the metric. Detection benchmarks on public traffic datasets show the model is sound. They do not predict counting accuracy at your junction, which depends on your angles, your light and your traffic. An honest vendor attaches any accuracy commitment to positions validated on site.
What classes, and how do they map to yours? Get the class list in writing. If you report FHWA classes or a national scheme, ask how each visual class maps onto it and which classes the system cannot separate.
How does it behave at night and in rain? Classification usually degrades before basic counting does. Ask for night clips from your site and for the light level each task needs.
Where does the video go? Find out whether processing happens on site, what leaves the network, how long video is kept and who can export it.
What does integration look like? Formats, an API, scheduled reports, role-based access and audit logs. Ask to see a sample export.
Who installs it in your country? For buyers outside the vendor's home market, confirm who surveys, installs and supports the system locally, and how remote support works.
THE ROLLOUT
How A Rollout Runs And What Goes Wrong
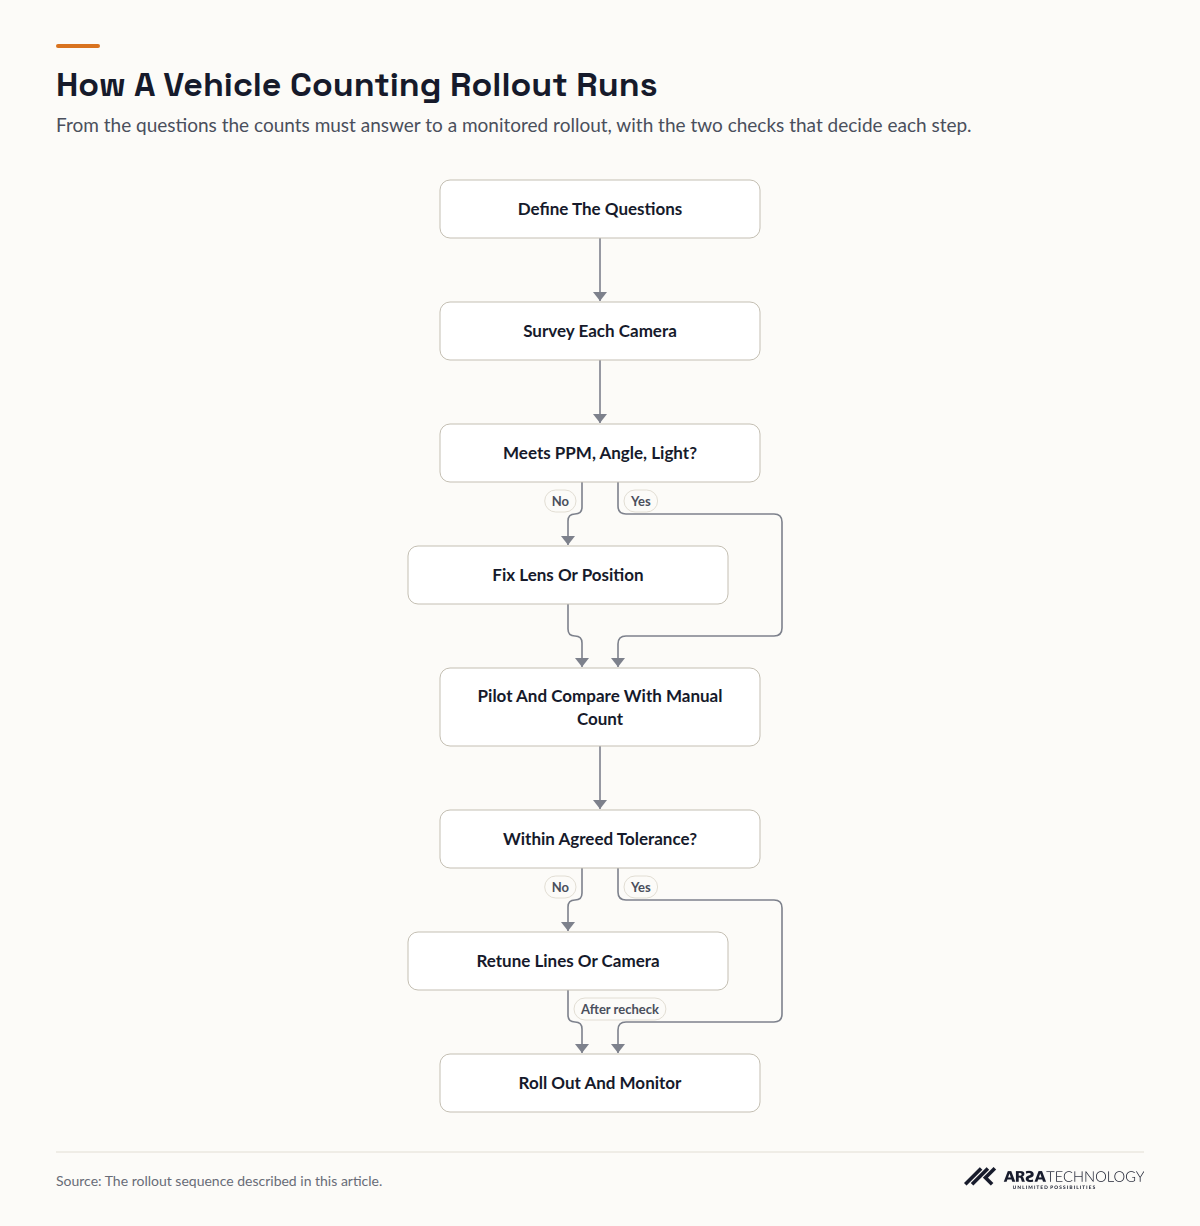
A sound rollout follows a fixed order: define the questions the counts must answer, survey each camera against the pixel density, angle and light thresholds, fix the positions that fail, pilot on real footage, check against a manual count, then roll out with monitoring. Most failures come from skipping the survey or the manual check.
Read As Text
- Define The Questions leads to Survey Each Camera
- Survey Each Camera leads to Meets PPM, Angle, Light?
- Meets PPM, Angle, Light? leads to Fix Lens Or Position (No)
- Meets PPM, Angle, Light? leads to Pilot And Compare With Manual Count (Yes)
- Fix Lens Or Position leads to Pilot And Compare With Manual Count
- Pilot And Compare With Manual Count leads to Within Agreed Tolerance?
- Within Agreed Tolerance? leads to Retune Lines Or Camera (No)
- Within Agreed Tolerance? leads to Roll Out And Monitor (Yes)
- Retune Lines Or Camera leads to Roll Out And Monitor (After recheck)
Define the questions first. "Peak hour truck volume on the north gate approach" tells you the camera, the lines and the classes. "Traffic data" tells you nothing.
Survey every position. Record mounting height, tilt, distance to the counting line, lens and light levels at night for each camera. Positions that fail get a specific fix: a different lens, a new position, another camera or added lighting.
Pilot on real footage. Run the system on several days that include a night, a wet day if your climate has them, and the peak. Count the same intervals by hand and compare by class and lane. Agree the tolerance before the pilot, so the result is a decision and not a debate.
Roll out and keep watching. Cameras get knocked, trees grow, lighting changes and roadworks move lanes. Any of these silently degrades counts, so a monthly check against a short manual sample catches the drift before it reaches your reports.
The Failures That Come Up Most
The camera was chosen for security. It looks down at the gate from 8 m, sees roofs, and cannot tell a van from a pickup. It may still count. It will not classify reliably.
The counting line sits in the occlusion zone. A line drawn where vehicles queue, or where a lane of tall trucks hides the next lane, double counts or misses vehicles. Move it to where vehicles are moving and seen apart from each other.
Night was never tested. A pilot run on sunny afternoons says nothing about 02:00 under sodium lights with headlight glare.
The stream came from the recorder. Re-streams from an NVR are often transcoded, drop frames and shift in time. Pull from the camera where it supports a second stream.
Classes were never mapped. The counts arrive in visual classes and the planning model expects axle classes, so the data sits unused. Agree the mapping before the pilot.
Alerts were treated as interlocks. Wrong-way or stopped vehicle alerts arrive within seconds. That is useful for an operator and too slow to stop a vehicle on its own. Design the response around a person.
FURTHER READING
How ARSA Approaches Vehicle Counting
ARSA Technology runs vehicle counting and classification as Traffic Monitor, either on an AI Box in the roadside cabinet or as software on servers the customer already owns. It counts cars, trucks, buses, motorcycles and bicycles by lane and direction, with colour, estimated speed between line pairs and congestion per lane. Plate reading with a watchlist is an add-on that uses one third of a unit's camera capacity, and it is built for Indonesian plates, so other countries' formats are custom work. Results go out over DATEX II v3, a REST API, webhooks and CSV, Excel or PDF reports. Video is processed on site and recorded continuously, kept 3 days by default and configurable from 1 to 90 days. ARSA's published vehicle detection benchmark is 0.887 AP50 on the UA-DETRAC traffic dataset (0.799 at IoU 0.7). That is a model benchmark, and accuracy at a given site is stated only after its cameras have been validated.
Every position is checked against the ARSA-CVS-001 standard before a commitment, through a Remote Camera Design Review, an On-Site Camera Survey or a feasibility assessment, followed by a pilot deployment or turnkey implementation. ARSA delivers outside Indonesia, and where visa conditions prevent its engineers travelling, a qualified local partner installs under ARSA supervision. ARSA built the plate, VIN and engine number recognition platform for Korlantas Polri, Indonesia's traffic police.
FAQ
Frequently Asked Questions
How Accurate Is AI Vehicle Counting?
Accuracy depends on the camera position, so the only figure worth trusting is one measured on your own footage against a manual count. Detection benchmarks on public datasets show whether a model is sound, but pixel density, angle, light and occlusion at your site decide the final count. Ask for a pilot comparison by class and lane, with the tolerance agreed in advance.
Can I Use My Existing CCTV Cameras For Vehicle Counting?
Often yes, provided each camera meets the thresholds for the task. Counting needs about 67 pixels per metre at the vehicle, which a 2 MP camera with a 60 degree lens reaches up to 24.9 m. Classification needs about 107, up to 15.6 m. A camera mounted steeply for security may count well and classify poorly.
What Is The Difference Between Vehicle Counting And Vehicle Classification?
Counting records that a vehicle crossed a line in a given lane and direction. Classification also records what type it was. Classification needs roughly 60% more pixels per metre than counting, a narrower tilt band and twice the light, so a position can pass for counting and fail for classification.
Do AI Cameras Produce FHWA 13-Class Counts?
Not directly. FHWA's scheme is based on axle count and spacing, and video classifies by how a vehicle looks. Visual classes can be mapped onto groups of FHWA classes for many purposes, but submissions that need full axle-based classes usually keep axle sensors at some stations and use video to extend coverage.
Does Vehicle Counting Work At Night And In Rain?
Yes, within limits. Counting needs about 10 lux on the road and classification about 20, and a wide dynamic range camera helps with headlight glare. Heavy rain and very low light degrade classification before they degrade basic counting, so test both conditions in the pilot.
Is Vehicle Counting Video Covered By Data Protection Law?
Yes, wherever people or plates can be identified in the recorded video, and plate reading always is. In the UK the ICO expects a data protection impact assessment and defined retention for ANPR, and Singapore's PDPA, the UAE's PDPL and Australia's Privacy Act set comparable duties. Anonymous counts are low risk. The recordings and plate data need a legal basis and retention controls.
How Many Lanes Can One Camera Cover?
About three lanes for classification on a 2 MP camera with a 60 degree lens, which covers a strip about 11 m wide at its 15.6 m classification limit. Counting reaches further, so the same camera can count more lanes than it can classify. Wider roads need a second camera, a higher resolution sensor or a different lens.
Should Analytics Run At The Roadside Or On A Central Server?
Run them where the video already goes. If streams already reach a control room, a central server keeps maintenance in one place. If an approach has no video backhaul, an edge unit in the roadside cabinet processes the video locally and sends only the counts upstream.
To see how this works in a real deployment, read about the vehicle counting camera system. If you would like to know what your own cameras can do, send a few clips for a free AI assessment by an ARSA engineer.